This documentation is for an older version of GoodData.
Go to the latest version.
Visualize Your Data
Analytical Designer allows you to visualize your data using an array of analytical tools and insight types.
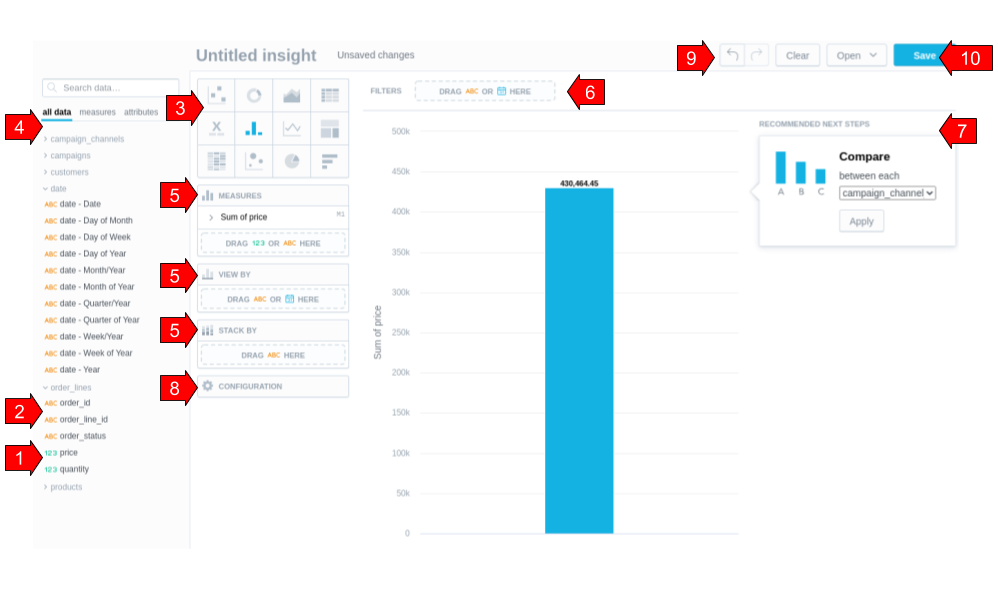
In Analytical Designer, you can:
1 Analyze measures that represent quantitative data.
2 Analyze attributes that represent qualitative data.
3 Switch among multiple types of insights. For details, see Insight Types.
4 Drag data from your Data Catalog to any active drop zone of the canvas to start creating your insight (or visualization).
5 Drag data from these zones back to Data Catalog to remove them from your insight.
6 Drag any attribute to the bar to filter your data.
7 Use suggestions that help you modify your insight based on common usage patterns.
8 Configure your insight: change colors, modify axes, legends, and canvas. For details, see
Configure Insight Properties.
9 Navigate between steps or clear your insight.
10 Save your insight.
To learn how to work with Analytical Designer in more detail, read the following sections: