Summarize Visualizations and Dashboards with AI Assistant
You can use the AI Assistant to summarize visualizations and dashboard tabs on demand.
A visualization summary explains what a single visualization shows. A dashboard tab summary provides a short narrative across all visualizations on the active dashboard tab. Both summaries are generated inline in the AI Assistant and reflect the semantic context and data currently shown to the user.
Summaries are generated dynamically. They are not stored and always reflect the current filtered, drilled, and time-scoped state that the Assistant can access at the time of the request.
You can summarize:
- ad-hoc visualizations created by the AI Assistant during a conversation
- saved visualizations on a dashboard
- saved dashboard tabs
Summarize an Ad-Hoc Visualization
After the AI Assistant creates a visualization in the conversation, you can ask it to summarize that visualization. The Assistant uses the visualization configuration and the computed values it already holds from the conversation. No additional data fetch is needed.
The summary can use the semantic descriptions of the metrics and attributes in the visualization, together with the visualization configuration, filters, time range, and computed values available in the current conversation.
Examples
What does this chart show?Summarize this visualization.Explain this chart.
You can also ask for a visualization and a summary in the same request. In that case, the Assistant creates the visualization and follows it with a summary in the same response.
Summarize a Saved Visualization on a Dashboard
You can also summarize a saved visualization directly from a dashboard.
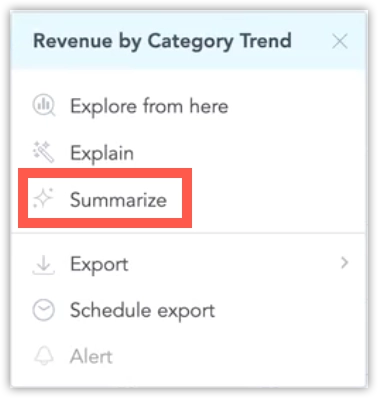
Steps:
- Open the dashboard.
- On the visualization you want to summarize, click the … (ellipsis) button.
- Click Summarize.
This opens the AI Assistant and immediately starts the summarization request for that visualization. The summary reflects the exact state currently shown on the dashboard, including:
- active filters
- drill level
- time comparison settings
The Assistant reads the current computed result from the execution cache through MCP, so the summary describes the visualization as the user currently sees it. It does not trigger a new computation or use an export to produce the summary.
Saved dashboard visualizations are summarized from the visualization context menu. If you ask the Assistant in chat to summarize a specific dashboard visualization, the Assistant directs you to use the Summarize action from the visualization menu. This action provides the required context, such as the visualization identifier, current filters, drill state, and execution cache reference.
Summarize a Dashboard Tab
You can summarize a saved dashboard tab from the dashboard UI. Use this when you want a concise narrative that brings together the most important points across the visualizations on the active tab. The summary is not a chart-by-chart list. It is intended to synthesize the visible dashboard tab into a short analytical narrative that highlights common themes, notable trends, outliers, and the filter context.
After the summary is posted, you can ask follow-up questions in the same Assistant thread. For example, you can ask the Assistant to explain a finding, create a follow-up visualization, or clarify the filter context used in the summary.
Steps:
- Open the dashboard.
- Open the tab menu for the tab you want to summarize.
- Click Summarize tab.
If the dashboard has only one tab, use the dashboard menu and click Summarize dashboard instead. The dashboard tab summary reflects the current dashboard state, including:
- active dashboard filters
- visualization-level filters
- drill state
- time comparison settings
- the current user permissions
- the current user locale
Where available, the summary can also use tab semantic descriptions, visualization descriptions, metric and attribute descriptions, text and rich-text widget content, and data timestamps from the execution cache. Image widgets are not included in the summarization context.
Date filters are expressed as resolved date ranges where possible, for example Mar 13-20, instead of relative expressions such as Last 7 days.
How Summaries Work
Summaries are generated synchronously and inline. The Assistant returns the result in the same response, without using a background queue or a separate waiting step.
For saved dashboard visualizations and dashboard tabs, the Assistant reads the current computed results. It does not trigger a new computation or export to produce the summary.
For dashboard tab summarization, the Assistant summarizes the visualizations that are available in the current tab context and creates one combined narrative.
The execution cache provides the computed result as it was last executed for the current user, including the filter and drill context that produced it. The summary only describes data that the current user is permitted to see.
What the Summary Includes
Depending on the summarized content, the summary can explain:
- what the visualization or dashboard tab represents
- which metrics and attributes are used
- the current breakdown or drill context
- notable trends, top contributors, or outliers
- the active filter or time context
- common themes across multiple visualizations on a dashboard tab
The output focuses on the analytical purpose of the tab, cross-visualization themes, trends, outliers, relationships, and the active filter context. For KPI tiles (headlines), the Assistant keeps the summary shorter and focuses on what the metric measures, the current value, and trend direction if available.
When a Summary Cannot Be Generated
- If a visualization has not been computed for the current user, the Assistant cannot summarize it.
- If a visualization has only zero or null values under the current filters, the Assistant clearly states that no data is available for the current filters and suggests checking the filter configuration. It does not hallucinate values.
- If a visualization or dashboard tab does not have semantic descriptions available, the Assistant can still provide a structural summary based on available metric names, attribute names, titles, and data. The summary may be less detailed when semantic context is limited.
- Dashboard tab summarization is available only from the dashboard UI. If you type a request such as
Can you summarize this tab?directly into the chat, the Assistant asks you to use Summarize tab from the tab menu, or Summarize dashboard for a single-tab dashboard. This gives the Assistant the full structured context of what is visible on the dashboard.
Notes
- Summaries reflect the current visualization or dashboard tab state, not a static saved summary.
- No summaries are stored on dashboards.
- If you change dashboard filters, drill state, or time comparison settings, a new summary reflects the updated state.
- The summary only describes data available in the current visualization or dashboard tab context.
- Summaries respect the current user’s permissions and describe only data available to that user.
- If the current dashboard state has not been computed yet, open the visualization or dashboard tab first and then try summarizing again.
- Very large or complex dashboard tabs may take longer to summarize because the Assistant needs to read and synthesize data for multiple visualizations.
Limitations
- Dashboard tab summarization is available from the dashboard menu only. Natural-language requests in the chat direct users to the dashboard menu action.
- Dashboard tab summaries are generated synchronously. There is currently no background processing, queue, or follow-up delivery.
- The summary covers the active dashboard tab only. It does not summarize multiple tabs or an entire multi-tab dashboard at once.
- Summarization is intended for on-demand analysis. Scheduled summaries, event-triggered summaries, stored dashboard summary widgets, and exporting summaries as standalone documents are not supported.
- If a dashboard tab contains visualizations that are not available in the current computed state, open the visualizations on the dashboard first and try again.