Key Driver Analysis
Key Driver Analysis (KDA) helps you understand what drives changes in your metrics. It identifies and ranks the factors, or drivers, that have the strongest influence on a selected KPI, such as revenue, NPS, conversion rate, or churn.
You can run KDA directly from a dashboard, launch it from a visualization created by the AI Assistant, or start it through the AI Assistant using a natural-language question such as Why did my total sales drop last month?
KDA is useful when you want to quickly understand what contributed to a change in a metric without manually testing many possible breakdowns.
Prerequisites
Before using KDA, metadata synchronization must complete successfully. KDA becomes functional only after the AI Assistant has successfully answered at least one question. If the AI Assistant responds that metadata synchronization is still running, wait until synchronization is finished before using KDA.
How It Works
Choose a target metric and a set of candidate drivers, such as device, region, plan, version, feature usage, or support status.
The system analyzes the data and measures how each driver affects the selected metric:
- Snapshot view: Compares the current value against the average.
- Change over time: Compares the difference between the selected period and a baseline.
The results appear as a ranked list of drivers showing:
- Direction of impact (↑ or ↓)
- Size of impact (in points or percentage points)
- Share of data (N)
- A short explanation describing the relationship
After reviewing the results, you can adjust filters, comparison periods, or analyzed attributes directly in the KDA window and rerun the analysis to refine the output.
Tip
Use KDA to quickly identify key drivers of change, then follow up with Root Cause Analysis (RCA) to confirm the cause and decide on next steps.
KDA and Root Cause Analysis (RCA)
| Key Driver Analysis (KDA) | Root Cause Analysis (RCA) |
|---|---|
| Fast, data-driven association that shows what moved with the metric. | In-depth causal investigation to explain why the change happened. |
| Helps you see which drivers matter most in the data. | Used to verify findings through logs, experiments, or user research. |
When to Use KDA
Use KDA when you need to understand what explains a change in a metric or performance trend.
Examples:
- Product: Why did NPS increase this week? Which features contributed to conversion?
- Marketing / Growth: Which campaigns or segments contributed to a drop in activation rate?
- Customer Success: Are open tickets or long resolution times linked to churn this month?
- Operations / Quality: Did a new app version or crash rate affect yesterday’s CSAT?
Supported and Unsupported Date Granularities
KDA can be triggered only from visualizations sliced by supported date attributes and base granularities. The analysis runs when the visualization is sliced by Dataset Date, for example Date or OrderDate, and grouped by one of the following:
- Year
- Quarter
- Month
- Week
- Day
- Hour
- Minute
Other special date attributes are not supported, such as:
- Hour of Day
- Day of Year / Month / Week / Quarter / Year
- Week of Year
- Week of Month
- Dataset-date combinations not based on the supported granularities
If a visualization uses an unsupported granularity, such as Hour of Day, the Run Key Driver Analysis option does not appear in the menu.
How to Use KDA
Run KDA from a Dashboard
Open a dashboard and select a data point in a visualization.
- The data point must contain a metric value.
- The visualization must be segmented by date.
- KDA compares the selected data point with a previous data point or with the same period in the previous year.
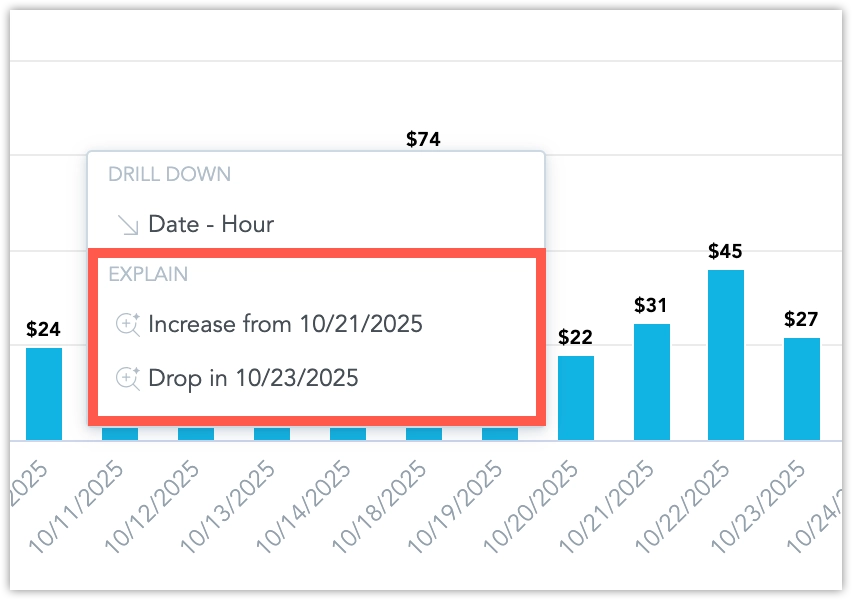
From the context menu, select Run Key Driver Analysis.
Choose whether to run KDA vs Previous Data Point or vs Previous Year.
The system labels the analysis as an Increase or Drop, depending on the change.
A modal window appears with the KDA results.
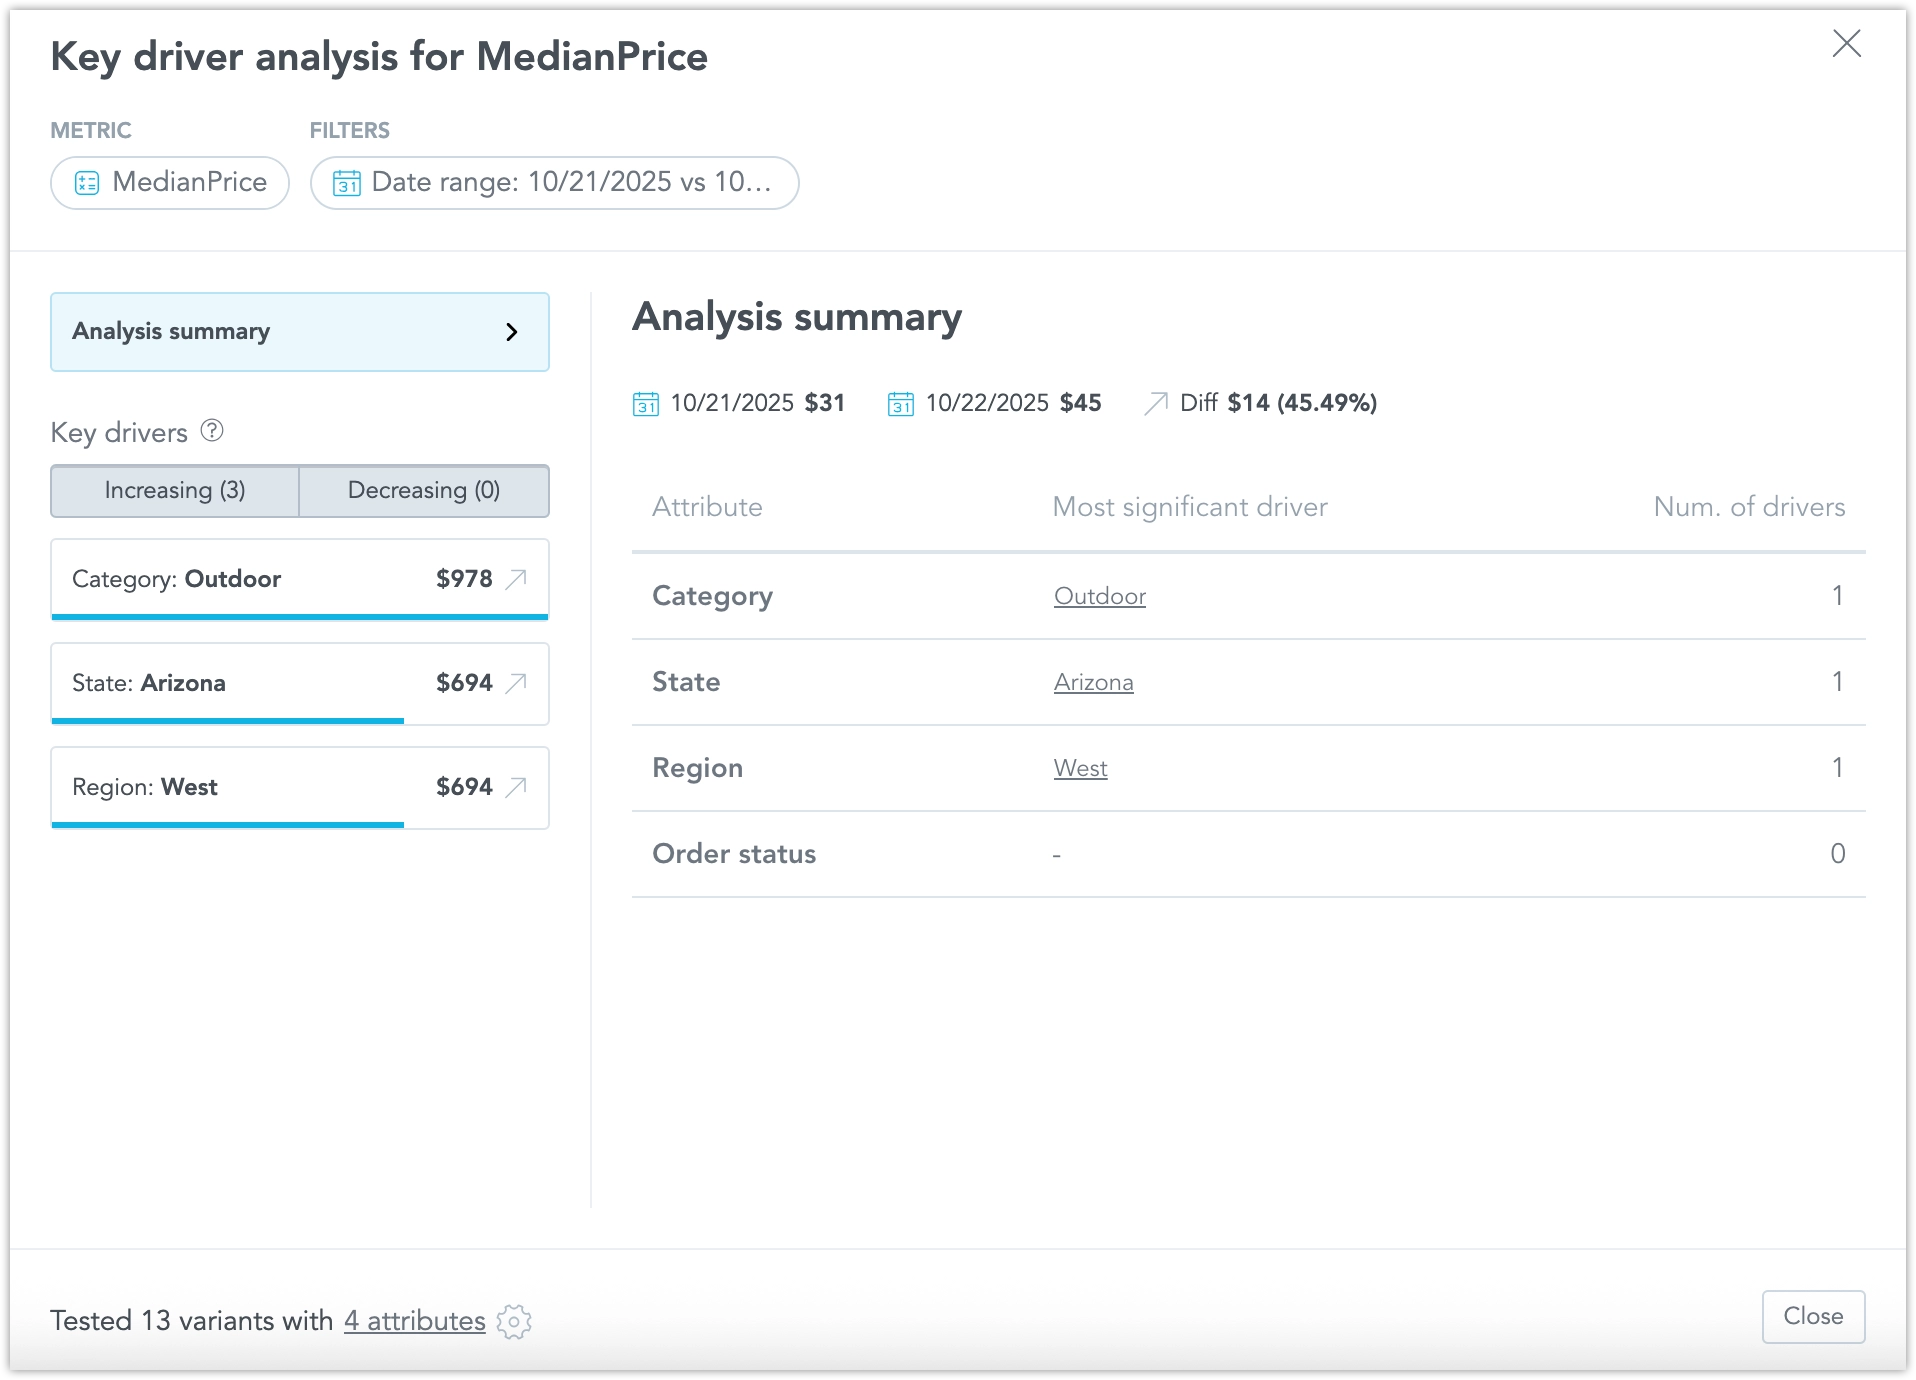
The modal shows:
- the analyzed data points and the difference between them
- the number of tested combinations
- a list of analyzed attributes and their corresponding drivers
- attributes automatically selected by the system for analysis
Tip
The system automatically identifies compatible attributes, so you do not need to manually select drivers before running the analysis.
Run KDA from the AI Assistant
You can run KDA from visualizations created by the AI Assistant or by asking a natural-language question.
From an ad-hoc visualization:
- Ask the AI Assistant to create a visualization, for example: Show me total sales by month.
- Select a data point in the generated visualization.
- Open the context menu and choose Run KDA vs Previous Data Point or Run KDA vs Previous Year.
Using conversation:
You can also ask questions such as:
- Why did my total sales drop last month?
- Explain the change in July.
- Run key driver analysis for revenue in June.
The AI Assistant identifies the relevant metric, time period, comparison period, and compatible attributes. If important information is missing, the Assistant asks a follow-up question.
When the inputs are clear, the Assistant returns a short response with the selected metric, date period, filter context, and a link to open the full KDA results.
Tip
Use conversational analysis to get a quick explanation from the AI Assistant, then open the full KDA results for deeper exploration.
Refine and Customize the Analysis
Within the KDA window, you can customize what the analysis includes:
- Adjust comparison periods, such as previous period or previous year.
- Add or remove attribute filters.
- Include or exclude analyzed attributes.
- Rerun the analysis with the updated configuration.
These options let you control the scope of the analysis and focus on the drivers that are most relevant to your question.
Explore Drivers in Detail
After running KDA:
- Select a driver in the results to open its detailed view.
- Review the driver chart and surrounding attribute values.
The detail view shows a column chart with the selected driver and related attribute values. The number of displayed columns is limited to keep the chart readable.
The detail view also includes the Change Significance Threshold line. Values that cross this threshold are considered significant drivers of the analyzed change.
Drill Deeper into a Driver
- Run KDA and open the driver details.
- Select a column in the chart to drill into that driver.
This adds a new attribute filter to the KDA setup and reruns the analysis with the updated context.
Note
Drilling down helps you refine the analysis and discover second-level drivers that explain the result more precisely.
Limitations
- KDA supports only base date granularities. Extended time dimensions, such as Week of Month or Hour of Day, are not supported.
- KDA works only with metrics that have a clearly defined MAQL expression. It does not support ad-hoc metrics.
- KDA becomes active only after metadata synchronization has completed.
- KDA requires enough data and compatible attributes for the selected metric and comparison period.