Anomaly Detection
Anomaly detection helps you identify unusual changes in time-based metrics. You can use it in two ways:
- Anomaly detection alerts notify you when a monitored metric behaves unexpectedly.
- Anomaly investigation in visualizations highlights unusual data points directly in a line chart so users can investigate them on a dashboard.
You can also investigate anomalies from chat with the Agentic AI Assistant using the Anomaly Detection skill. The skill is intended for immediate, ad-hoc analysis.
Related documentation:
- To configure anomaly markers in eligible line charts, see Use Smart Functions.
- To investigate anomalies from chat, see Anomaly Detection Skill.
What Anomaly Detection Does
When anomaly detection runs on a metric, the system looks at the metric over time and finds values that are unexpectedly higher or lower than usual. It considers:
- overall trend, such as whether values are generally going up or down
- repeating patterns, such as weekly or yearly cycles
- sudden changes that do not match the expected pattern
The result can be used either to trigger an alert or to highlight anomalies in a visualization.
Anomaly Detection Alerts
Anomaly detection alerts help you monitor important KPIs without manually checking dashboards. When an anomaly is detected in the monitored period, GoodData sends a notification through the selected notification channel.
Who Can Use Anomaly Detection Alerts
You need access to both:
- Alerts
- AI Assistant features
Create an Anomaly Detection Alert
Open a dashboard and find a visualization with a trendable metric.
Open the visualization menu and go to Alerts, then select Create.
In the setup dialog:
Select the metric to monitor. If the visualization has multiple metrics, the first metric in alphabetical order is selected by default.
Select Aggregate by: day, week, month, quarter, or year. By default, this matches the granularity used in the visualization.
Optionally, add filters, for example
Country = US.Select sensitivity: Low, Medium (default), or High.
Select the trigger mode:
- Every time
- Once per interval
If you select Once per interval, select Trigger interval.
For anomaly alerts, Once per interval is the default trigger mode.
By default, Trigger interval matches the selected Aggregate by value. If you change Aggregate by, Trigger interval is updated automatically unless you have already changed Trigger interval manually.
Choose what happens when an anomaly is detected, such as sending an email or using another available notification destination.
Confirm to create the alert.
Alert Evaluation
Anomaly alerts evaluate only the last completed period selected by the alert creator. The current unfinished period is not checked for anomalies. For example, a daily alert checks the previous day, and a weekly alert checks the previous completed week.
Checks run based on the selected granularity:
- daily checks evaluate the previous day
- weekly checks evaluate the previous week after the week ends
- monthly checks evaluate the previous month, and so on
Alert Settings and Data Requirements
The system uses up to the last 5 years of history by default. If less history is available, it uses what exists.
If there is not enough data to evaluate anomalies, alerts are not triggered until enough history is collected.
If some data points are missing, the system automatically fills them in using the median value of your available data so the analysis can continue with incomplete data.
Seasonality is calculated statistically and automatically selected. The system uses a single seasonality level that is higher than the monitored metric’s granularity. It does not combine multiple seasonalities.
Mapping used: metric granularity to seasonality:
- day to week
- week to month
- month to year
- quarter to year
- year to no seasonality
Date range filters are not used for anomaly detection.
Trigger interval contains only date granularities. Time granularities are not available.
If you use Once per interval, the alert can trigger at most once in the selected interval, for example once per day or once per week.
Intervals shorter than the evaluation frequency are not available.
The platform evaluates anomaly alerts using the schedule defined by your organization or dashboard settings. When an anomaly is found, the alert is suppressed until the selected interval ends.
Important Notice
When data is loaded gradually over a longer period, anomaly detection may evaluate incomplete data.
For example, if yesterday’s data is loaded every hour and anomaly detection runs early in the day, the system may evaluate only part of yesterday’s data. This can incorrectly flag a normal day as anomalous, or miss a real anomaly until the full load finishes.
If data is not loaded within the selected interval, an existing anomaly may also be missed. For example, if data loading fails for several days and the data arrives later, the system checks only the most recent expected period and may not detect an anomaly that happened earlier.
Anomaly Notifications
If an anomaly is found, you receive a notification through the selected channel. The message includes:
- alert name
- metric name
- granularity, such as how often it is checked
- time period
- actual value
- applied filters, if any
- link to open the dashboard or visualization
Example:
- Metric: Net sales
- Frequency checked: weekly
- Period: Week 42 / 2025
- Actual value: 155K
- Filters: Country = US
- Triggered at: 12.11.2025 11:00 CET
- Link: open dashboard
Anomaly Investigation in Visualizations
You can highlight anomalies directly in a visualization so that unusual data points are visible at a glance on dashboards. This is useful when you want users to notice unexpected changes during regular dashboard review, without creating a scheduled alert.
This is an investigation feature, not a notification feature. No alert is sent only because anomalies are displayed in a visualization. For the configuration steps in Analytical Designer, see Use Smart Functions.
When the Option Is Available
In Analytical Designer, anomaly detection in visualizations is available only when all of the following conditions are met:
- The visualization type is Line chart.
- Exactly one metric is used.
- The metric is sliced by a date attribute.
Only users with AI Assistant permission can use anomaly detection in visualizations, both in Analytical Designer and on dashboards.
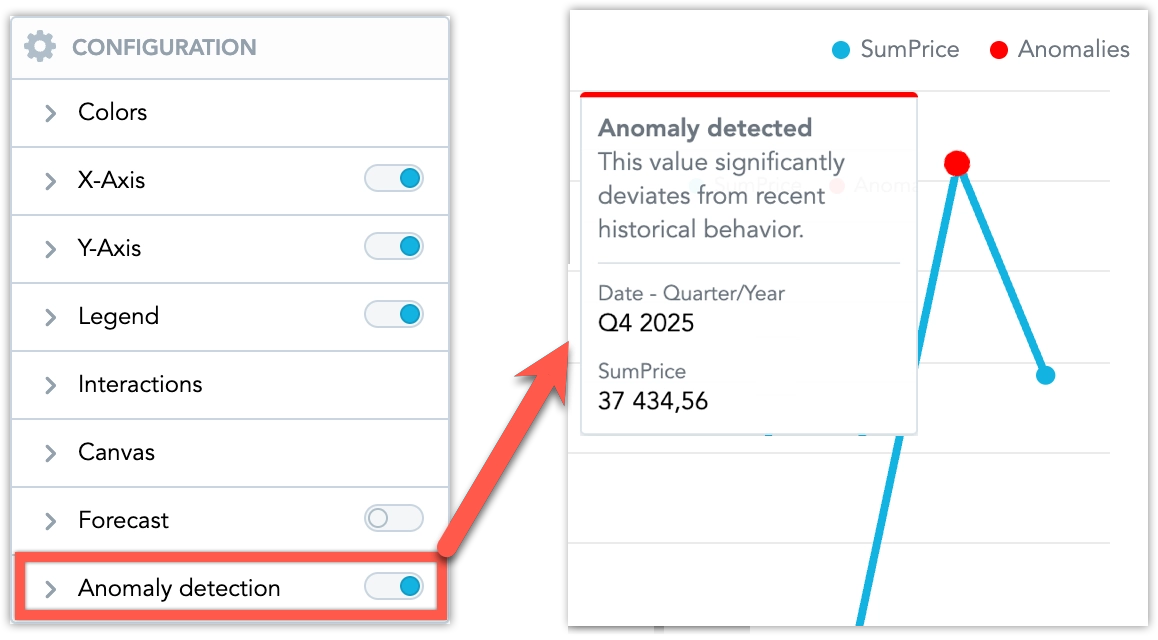
Configure Anomaly Detection in a Visualization
When anomaly detection is enabled for an eligible line chart, additional configuration options appear:
- Sensitivity
- Low: only large, rare deviations
- Medium (default): balanced signal-to-noise
- High: more aggressive detection
- Indicator color
- Indicator size
The indicator shape cannot be configured directly. It follows the Distinct point shapes setting in the visualization canvas.
After anomaly detection is enabled, normal data points keep their standard styling and anomalies are visually emphasized.
Tooltip and Legend Behavior
When you hover over a highlighted anomaly point, a tooltip explains why the point is marked as anomalous without requiring users to understand the underlying calculation.
When a chart contains a single metric and anomaly detection is enabled, the legend can be shown to help explain anomaly markers. Legend visibility is controlled by the visualization author.
Alerts and Visualization Consistency
Anomaly alerts and anomaly markers in visualizations are configured separately. You may receive an anomaly alert for a visualization where anomaly markers are not displayed, or for a different granularity than the one shown in the visualization.
If anomaly markers are hidden for a visualization, GoodData may show a warning when you schedule an anomaly alert. For example:
Anomaly markers are currently hidden on this visualization. Alert recipients will not see anomalies highlighted in the dashboard.
This keeps alerting flexible while making the behavior clear to users.
Investigate Anomalies With the Agentic AI Assistant
You can use the Anomaly Detection skill in the Agentic AI Assistant for immediate, ad-hoc anomaly investigation. Use this skill when you want to ask questions such as:
Are there any unusual patterns in sales over time?Find anomalies in revenue by region.What looks abnormal in support ticket volume this month?
The skill can run anomaly detection from chat, show a visualization, and, when data sharing is enabled, summarize what was found in natural language. It is designed for investigation and exploration. For recurring monitoring and notifications, use anomaly detection alerts instead.