AI Publisher
AI Publisher lets you create presentation-style documents that combine live workspace data, saved visualizations, text, filters, and workspace-specific branding.
A report remains a live object that you can reopen and update. Exporting a report creates a static PDF or editable PPTX file.
Experimental Feature
AI Publisher is an experimental feature. The UI and API may change. The AI Publisher section is available only when the feature is enabled for your organization.
AI Publisher is intended for workflows where you prepare a reusable report for a customer, partner, or another recipient and update it for a new reporting period instead of rebuilding the document from scratch.

How AI Publisher Content Is Structured
A report combines its own content with the active workspace theme.
- Report content defines pages, page structure, text, visualization bindings, filters, variables, and the reporting period. The data remains live while you edit the report.
- Workspace theming provides colors, typography, visualization colors, logos, images, and backgrounds. The active theme is resolved when the report is rendered.
- An export is a static PDF or PPTX file rendered from the report at a specific point in time.
Changing the active theme can restyle existing reports without changing their stored report content.
Create and Open a Report
To use AI Publisher, the feature must be enabled for your organization and you need the Workspace.MANAGE permission.
Open the AI Publisher section in the workspace and click Create. Configure the report name and reporting period.
After the report is created, it opens in the report builder. To open an existing report, select it from the AI Publisher list or use the … (ellipsis) button and select Edit.
Edit Report Content
The report builder shows a live preview of the report output. You can edit the report and save the changes from the same surface.
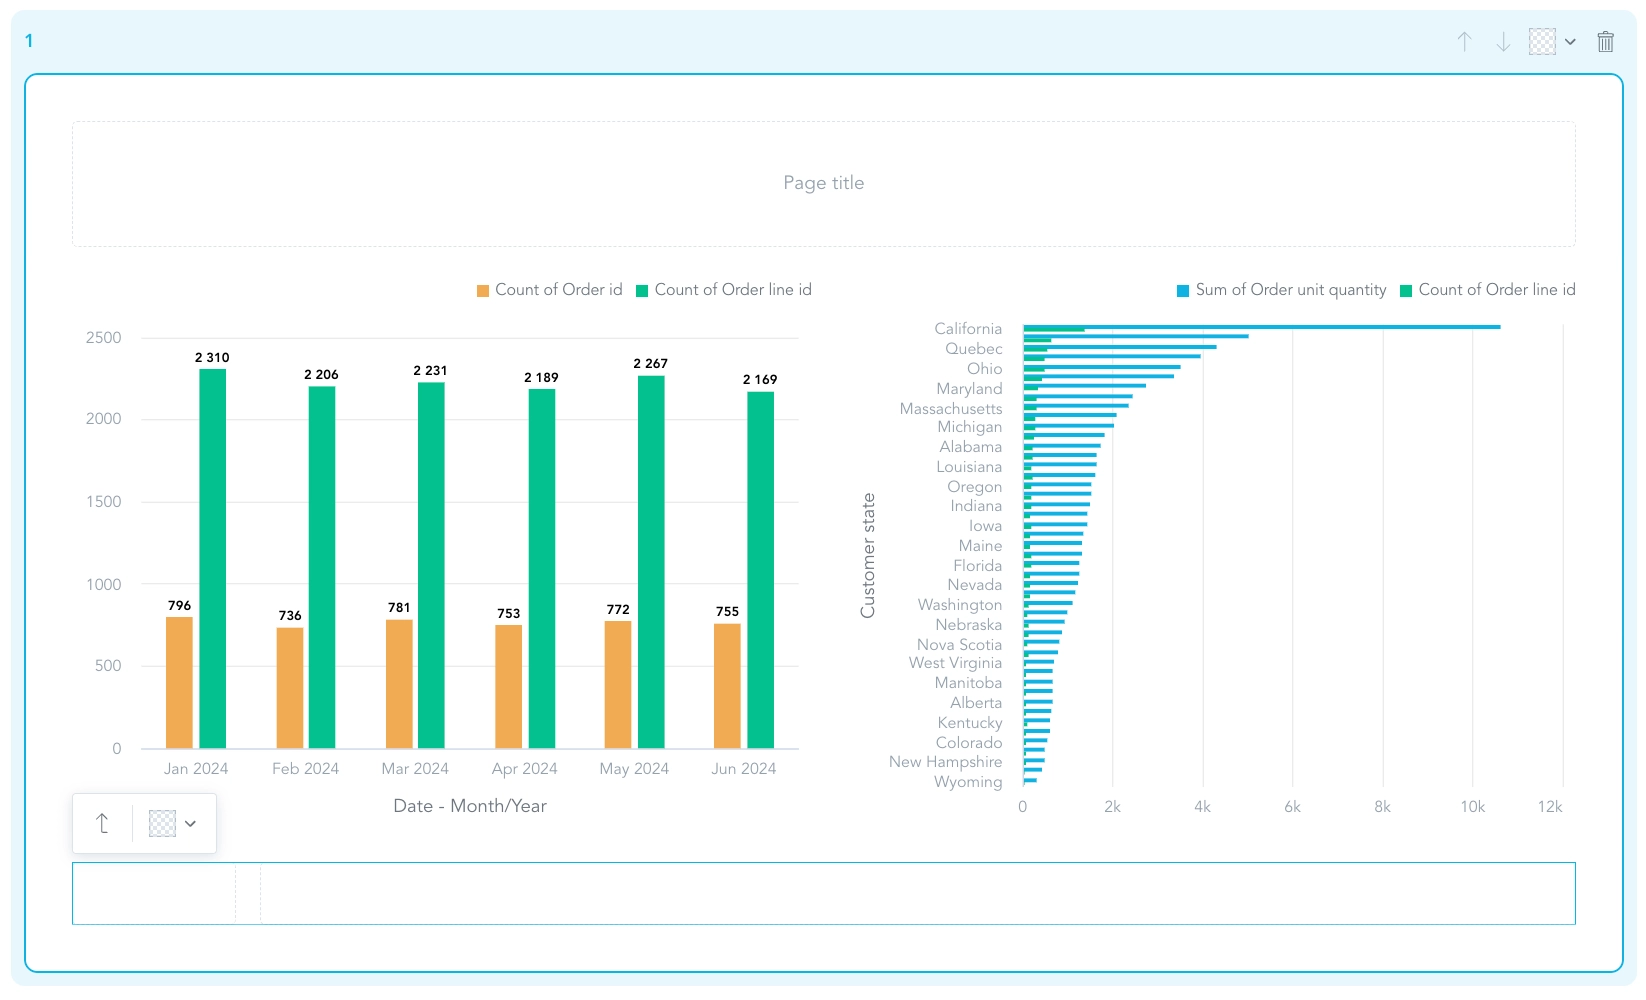
You can:
- Edit text, including bold and italic formatting, text style, color, background, and alignment.
- Configure image sources, fitting, and alignment.
- Select or replace a saved visualization in a visualization slot.
- Configure which date dimension is used to filter an individual visualization, or disable the report date filter for that visualization.
- Change the report period. Changing the period re-executes the visualizations in the report.
- Change report attribute filters and add or remove report filters.
- Add pages from the available page layouts, remove pages, and change their order.
- Insert dynamic variables into text.
Report pages can use widescreen, a4Portrait, or letterPortrait format.
Dynamic Variables
To insert a dynamic variable, select a text element and use + Insert. The variable is inserted at the text cursor and is replaced with its current value when the text element is no longer being edited.
Variables use single braces, for example {reportName}. An unknown variable remains visible as written. There is currently no escape syntax for rendering a literal variable marker.
| Variable | Value |
|---|---|
{reportName} | Report name |
{reportDescription} | Report description |
{periodStart} | Start of the report period |
{periodEnd} | End of the report period |
{reportDateRange} | Report date range |
{reportAttributeFilters} | Report attribute filters |
{exportedAt} | Export time. Resolves only during export. |
{exportedBy} | Exporting user. Resolves only during export. |
{lastModifiedAt} | Time when the report was last modified |
{lastModifiedBy} | User who last modified the report |
{workspaceName} | Workspace name |
{workspaceId} | Workspace ID |
{totalPages} | Total number of report pages |
{currentPageNumber} | Current page number |
{logo} | Primary report logo from the active theme |
Theme asset IDs also become variables. For example, an asset with ID cover_bg is referenced as {cover_bg}.
Custom variables can be declared through the API in content.variables and valued per report in variableValues:
{
  "content": {
    "version": "1",
    "pages": [],
    "variables": [
      {
        "name": "brandName",
        "title": "Brand",
        "defaultValue": "All brands"
      }
    ]
  },
  "variableValues": {
    "brandName": "Example brand"
  }
}
A custom variable resolves from variableValues, then from defaultValue. If neither is available, the marker remains visible.
Report Branding
Report branding comes from the active workspace theme. The active theme can be an organization theme or a workspaceTheme selected for the workspace with the ACTIVE_THEME setting.
Report-specific branding uses theme version 2:
reportsdefines the visualization palette, page background, editor color swatches, typography, fonts, and heading and paragraph text styles.assetsdefines logos, images, and backgrounds available to reports.
Example:
{
  "version": "2",
  "reports": {
    "visualizationPalette": ["#1b2a3d", "#6f8fa5", "#f2a900"],
    "page": {
      "backgroundColor": "#ffffff"
    },
    "colors": {
      "backgrounds": ["#ffffff", "#f4f6f8"],
      "text": ["#14202e", "#5a6b7c"]
    },
    "textStyle": {
      "color": "#14202e",
      "lineHeight": 1.4,
      "typography": {
        "fontFamily": "\"Example Sans\", Arial, sans-serif",
        "fonts": [
          {
            "family": "Example Sans",
            "url": "https://assets.example.com/example-sans.woff2",
            "weight": 400
          }
        ]
      },
      "heading": {
        "h1": {
          "fontSize": 4
        }
      },
      "paragraph": {
        "normalText": {
          "fontSize": 1.4
        }
      }
    }
  },
  "assets": {
    "logos": [
      {
        "id": "logo",
        "url": "https://assets.example.com/logo.svg",
        "title": "Primary logo",
        "altText": "Example"
      }
    ],
    "backgrounds": [
      {
        "id": "cover_bg",
        "url": "https://assets.example.com/cover.jpg",
        "title": "Cover background"
      }
    ]
  }
}
A bare numeric report length is interpreted as cqw, where 1cqw is 1% of the page width. cqi, em, and % are also supported. px, rem, cqh, and cqb are ignored for report theme lengths.
The {logo} variable resolves from an asset with ID logo, then the first logo asset, then the general theme logo, and finally the organization’s white-labeling logo.
Theme assets and fonts are hosted outside GoodData. The organization’s Content Security Policy must allow the asset host. For PDF and PPTX exports, the asset host must also provide appropriate CORS headers.
See Theme Settings Reference for the complete theme configuration.
Save a Report as New
To create a copy of an existing report, click the … (ellipsis) button in the AI Publisher list or in the report builder and select Save as new.
You can change the name and report period before creating the copy. The new report includes the current report content, including unsaved changes.
If a report is inherited from a parent workspace, you cannot overwrite the inherited report in the child workspace. Use Save as new to create an editable copy in the child workspace. Deleting the inherited report from the child workspace is not available.
When an inherited report is used in a child workspace, workspace data filters continue to scope visualization data. Report text is shown as written. Do not put recipient-specific facts in text that is inherited across workspaces.
Delete a Report
To delete a report, click the … (ellipsis) button in the Reports list or report builder and select Delete. Confirm the action in the dialog.
Export a Report
An export is a static snapshot. Exporting does not freeze the report itself. You can reopen the report, change its content or filters, and export it again as a new file.
You can export a report from the AI Publisher list or from the report builder. Click the … (ellipsis) button and select one of the following actions:
- Export (.pdf)
- Export (.pptx)
PDF exports use the same active workspace theme as the live report preview. PDF exports are generated on the backend. After you start the export, you can navigate away from the report while the export continues. When the export finishes successfully, the file is downloaded.
The exported PDF includes accessibility features such as tagged reading order, headings, text alternatives for visualizations, embedded fonts, document language and title, and selectable text. Tables are exported as tagged tables with header cells. Axis labels and legends remain selectable text.
The PPTX export keeps report text editable.
Export a PDF Through the API
You can generate a PDF without opening the report in a browser. The export jobs API uses a submit, poll, and download workflow.
A script can create or update a report, start the export job, poll the job status, and download the PDF after the export completes. This supports unattended and batch workflows, including generating reports across multiple workspaces.
Manage AI Publisher Reports Through the API
AI Publisher uses the report, reportTemplate, and reportPageLayout API entities. See the Reports API reference for endpoint details.
| Object | Collection path | Collection operations | Object operations |
|---|---|---|---|
| Page layout | /api/v1/entities/workspaces/<WORKSPACE_ID>/reportPageLayouts | GET, POST | GET, PUT, PATCH, DELETE |
| Report template | /api/v1/entities/workspaces/<WORKSPACE_ID>/reportTemplates | GET, POST | GET, PUT, PATCH, DELETE |
| Report | /api/v1/entities/workspaces/<WORKSPACE_ID>/reports | GET, POST | GET, PUT, PATCH, DELETE |
For object operations, append the object ID to the collection path.
The API stores content as free-form JSON. It does not parse, validate, or migrate the content. The maximum serialized content length is 250,000 characters. Invalid content can therefore be accepted by the API but fail when opened in the report builder.
Report Content Model
A report requires title, periodStart, periodEnd, and content. The period boundaries use inclusive YYYY-MM-DD dates. Optional attributes include description, tags, and variableValues.
The report content object has this basic shape:
{
  "version": "1",
  "pages": [],
  "filters": [],
  "variables": []
}
Each page contains a page structure and slots:
{
  "localIdentifier": "page_summary",
  "kind": "content",
  "format": "widescreen",
  "layout": {
    "type": "section",
    "direction": "column",
    "children": [
      {
        "type": "slotRef",
        "slotId": "page_summary_title",
        "weight": 2
      },
      {
        "type": "slotRef",
        "slotId": "page_summary_revenue",
        "weight": 9
      }
    ]
  },
  "slots": [
    {
      "type": "heading",
      "localIdentifier": "page_summary_title",
      "style": {
        "type": "h1"
      },
      "source": {
        "type": "static",
        "content": "Revenue for {reportDateRange}"
      }
    },
    {
      "type": "visualization",
      "localIdentifier": "page_summary_revenue",
      "insight": {
        "identifier": "revenue_by_month",
        "type": "insight"
      },
      "showTitle": true,
      "dateDataSet": {
        "identifier": "date.dataset.default",
        "type": "dataSet"
      }
    }
  ]
}
The layout is a recursive tree of section and slotRef nodes. A section uses direction: "row" or direction: "column". The optional weight controls its share of space inside the parent.
Supported slot types are visualization, heading, paragraph, and image.
A visualization must define dateDataSet for the report period to filter it. Without dateDataSet, the visualization is not filtered by periodStart and periodEnd. Set ignoreReportPeriod: true to opt out explicitly.
content.filters uses the dashboard filter-context structure. Content-level attribute filters are applied to visualizations. A content-level date filter can narrow the report period for its target date dataset.
Page Layouts and Report Templates
A page layout stores one reusable page definition in content. A report template stores reusable report content with version, pages, optional filters, and optional variables.
Page layouts and report templates are managed through the API. When their content is copied into a report, the report owns its copy. Later changes to the source object do not update existing reports.
Create a Report
curl -X POST "https://<ORGANIZATION_HOST>/api/v1/entities/workspaces/<WORKSPACE_ID>/reports" \
  -H "Authorization: Bearer <API_TOKEN>" \
  -H "Content-Type: application/vnd.gooddata.api+json" \
  -d '{
    "data": {
      "type": "report",
      "id": "quarterly-performance",
      "attributes": {
        "title": "Quarterly Performance",
        "description": "Quarterly business review",
        "periodStart": "2026-07-01",
        "periodEnd": "2026-09-30",
        "content": {
          "version": "1",
          "filters": [],
          "variables": [],
          "pages": [
            {
              "localIdentifier": "page_summary",
              "kind": "content",
              "format": "widescreen",
              "layout": {
                "type": "section",
                "direction": "column",
                "children": [
                  {
                    "type": "slotRef",
                    "slotId": "page_summary_title",
                    "weight": 1
                  }
                ]
              },
              "slots": [
                {
                  "type": "heading",
                  "localIdentifier": "page_summary_title",
                  "style": {
                    "type": "h1"
                  },
                  "source": {
                    "type": "static",
                    "content": "Quarterly Performance"
                  }
                }
              ]
            }
          ]
        }
      }
    }
  }'
A page layout inherited from a parent workspace is locked in the child workspace and cannot be updated or deleted there.
Troubleshooting AI Publisher Report Definitions
If a report created through the API does not render as expected, check these points:
- Slot identifiers must be unique within a page, and every
slotRef.slotIdmust match an existing slot. - The report period affects a visualization only when the visualization defines
dateDataSet. page.filtersare currently stored but not applied by the renderer.- Non-empty
slot.filtersorslot.propertiesare currently stored, but the visualization renders as a stub instead of a chart. slot.ignoredFiltersis currently stored but not evaluated.- Theme asset IDs share the same namespace as variables. Duplicate or invalid IDs are ignored.
- An external image can render on screen but disappear from PDF or PPTX if its host does not provide the required CORS headers.
Current Limitations
The experimental release has the following limitations:
- AI Publisher does not provide a built-in scheduling UI for report exports. You can automate PDF generation through the export jobs API.
- Page layouts and report templates are managed through the API.
- AI Publisher does not provide a separate read-only mode. Users who can open AI Publisher can edit reports.
- Report
contentis not validated by the API before it is stored. Invalid content can prevent the report from rendering correctly. - Some stored visualization configuration fields are not yet applied by the renderer, as described in Troubleshooting AI Publisher Report Definitions.