Conditional Formatting in Pivot Tables
Experimental Feature
This is an experimental feature that is still under active development. Its behavior may change in future releases, or the feature may be removed.
Conditional formatting lets you apply visual formatting rules to individual metrics and attributes in pivot tables so important values, exceptions, and status categories are easier to spot.
You can define rules based on metric thresholds or attribute values and apply formatting directly to the selected metric or attribute. This helps dashboard creators highlight meaningful values in the table without creating helper metrics or writing custom formatting syntax.
How It Works
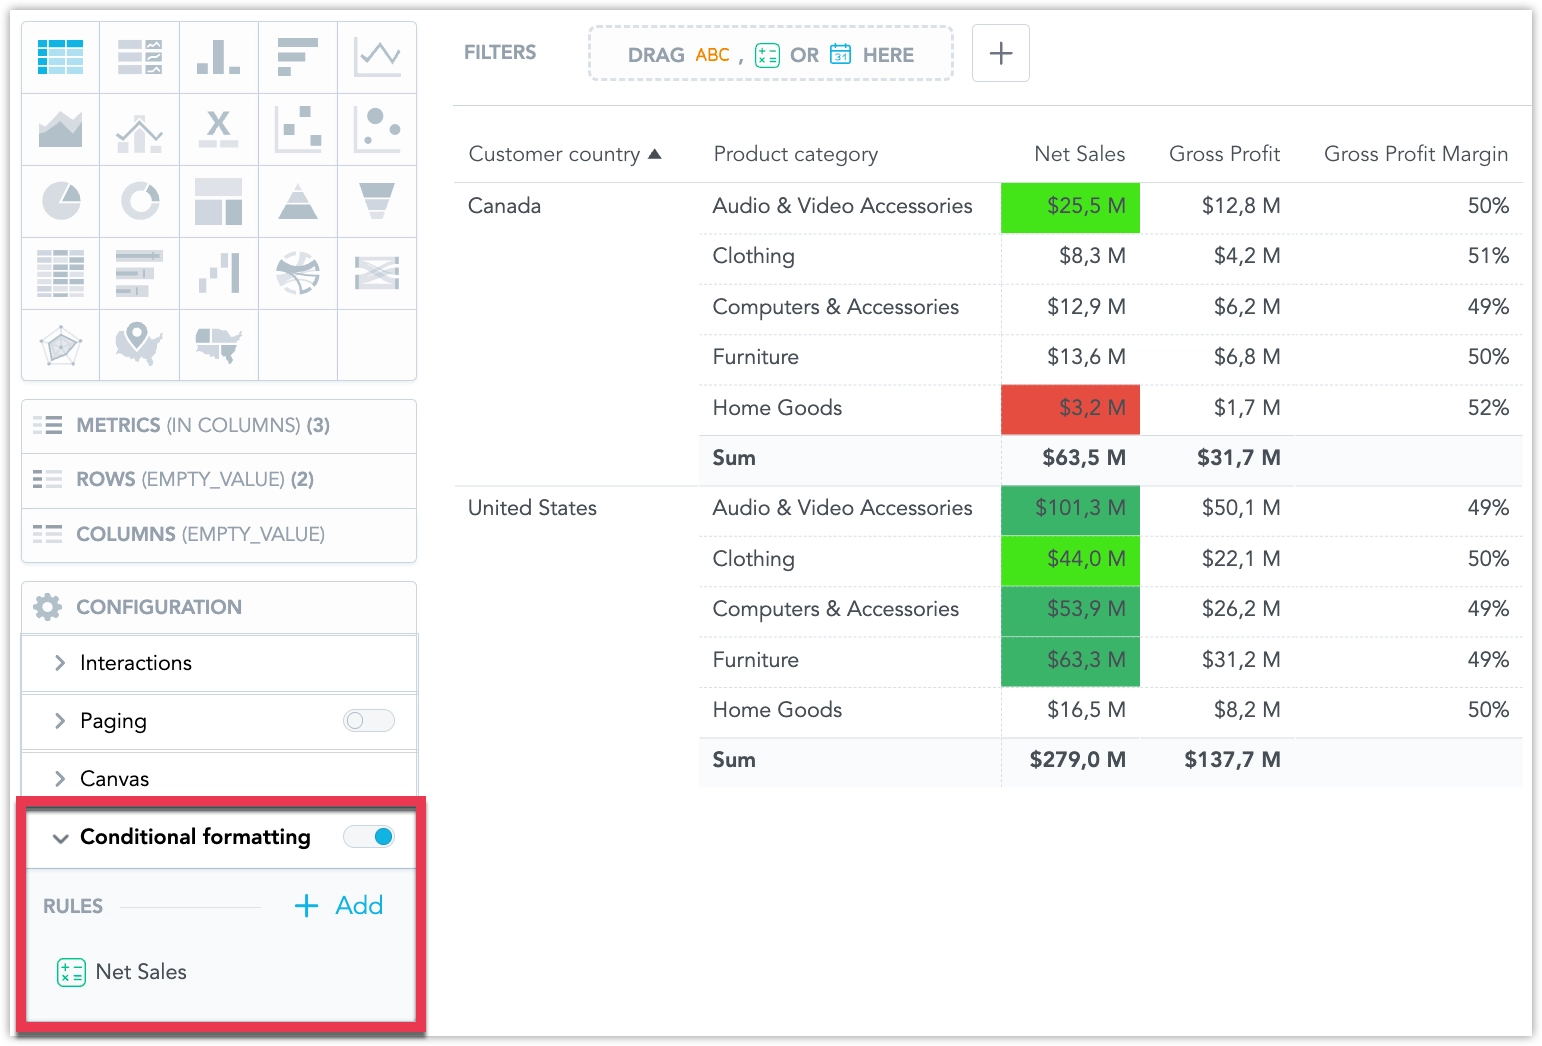
Conditional formatting rules are defined in the visualization configuration panel.
Each rule defines:
- the metric or attribute the rule applies to
- the condition that must be met
- the formatting style to apply
Rules are saved with the visualization and are applied when the visualization is viewed on a dashboard or embedded through the SDK.
Supported Conditions
You can use the following conditions when creating a rule:
- All values
- Equal to
- Not equal to
- Greater than
- Greater than or equal to
- Less than
- Less than or equal to
- Between
- Not between
- Is empty
- Is not empty
The available conditions depend on whether the selected column is a metric or an attribute.
How to Use Conditional Formatting
- Open a pivot table visualization.
- In the configuration panel, expand Conditional formatting.
- Click Add.
- Select the metric or attribute the rule applies to.
- Choose a condition.
- Define the condition value, if required.
- Choose the formatting style.
- Save the visualization.
The table preview updates immediately while you configure the rule.