AI Dashboard Builder: From Prompt to Working Dashboard
4 min read | Published



AI Dashboard Builder: From Prompt to Working Dashboard
Building a dashboard usually means clicking through a metrics catalog, picking chart types, and arranging widgets one at a time. An AI dashboard builder replaces that process with a single instruction: describe the dashboard you want in plain language, and the system finds the right metrics, creates new ones when needed, and assembles the widgets for you. For teams that build dashboards regularly, this cuts the time between a business request and a usable dashboard from hours to minutes.
Key Takeaways
- An AI dashboard builder turns a written description into a working dashboard by selecting or creating metrics, choosing visualization types, and placing widgets automatically.
- The two dominant approaches are one-shot generation (the full dashboard appears at once) and step-by-step generation (each widget is proposed and reviewed individually).
- GoodData.AI's Dashboard Builder Copilot supports both one-shot dashboard generation from a single prompt and iterative editing of an existing dashboard, letting users change any section, visualization, or description through conversational commands.
- The feature is built for two groups: Analytics Engineers who need to move faster from requirement to draft, and business users who currently depend on an engineer to build anything for them.
- It is available as part of the GoodData.AI AI add-on and works inside embedded analytics products through the SDK or web components.
What Is an AI Dashboard Builder?
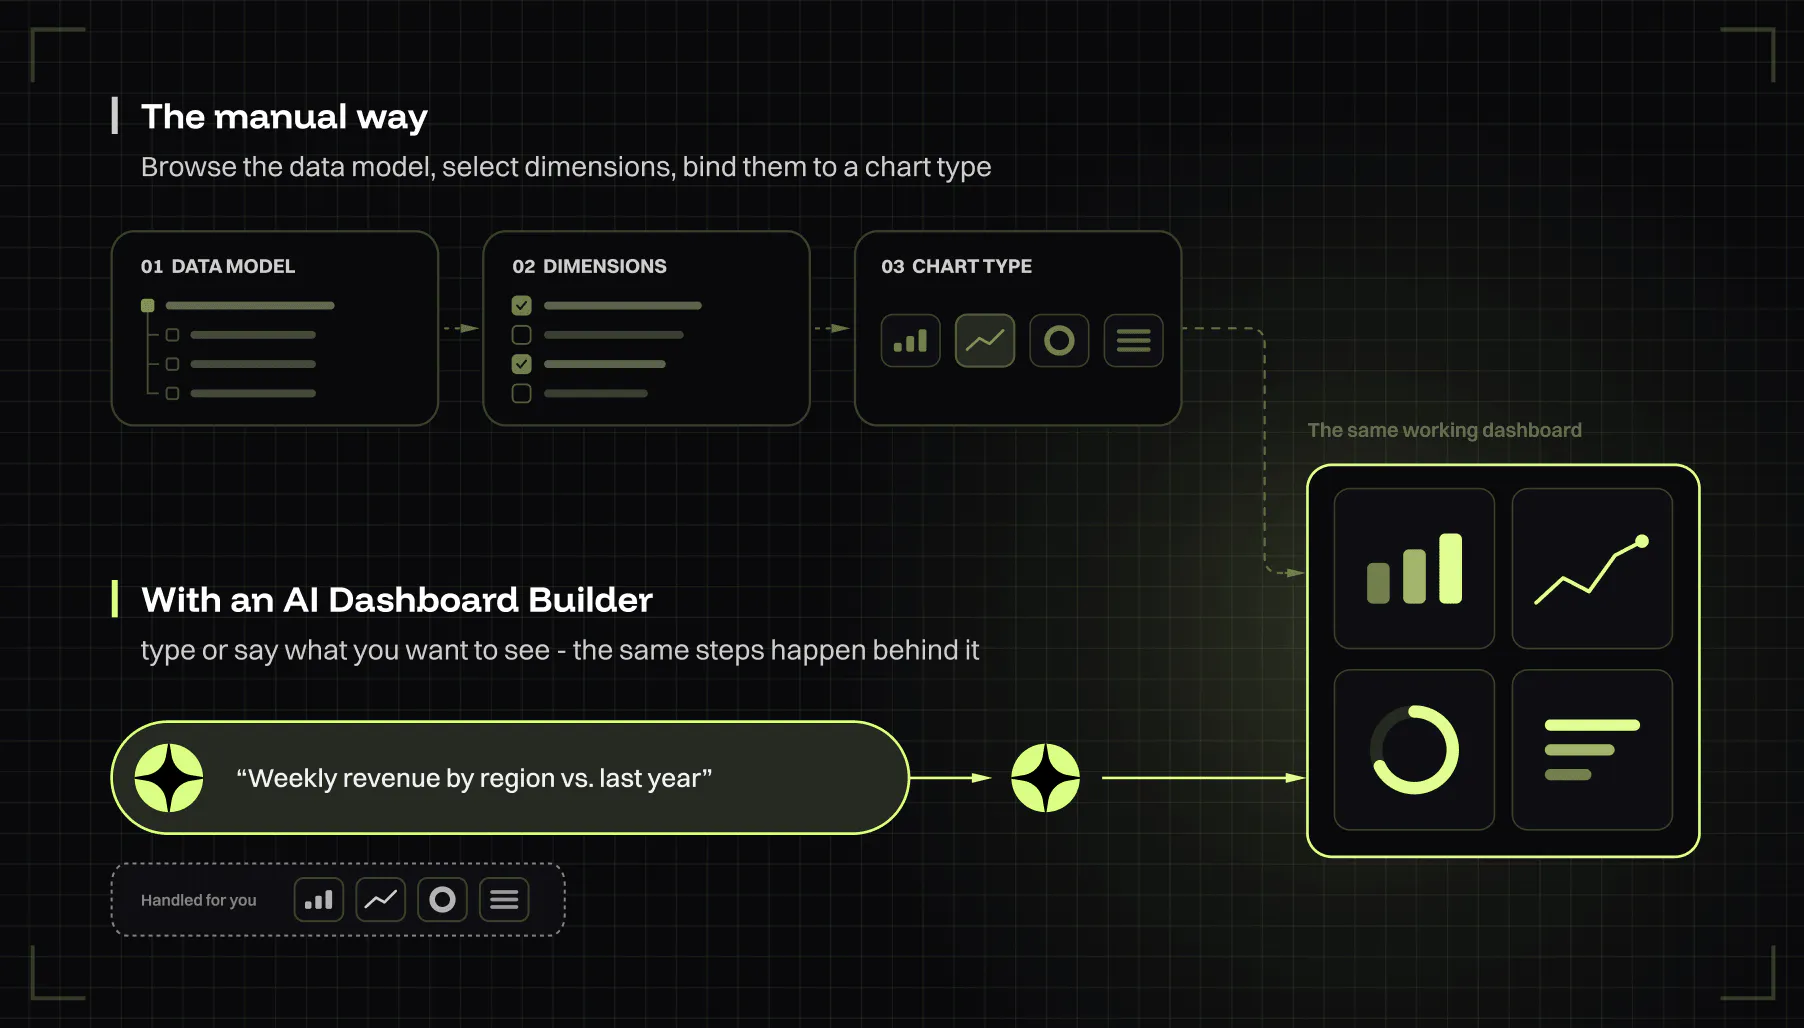
An AI dashboard builder is a feature that converts a natural-language request into a functioning analytics dashboard. Instead of manually browsing a data model, selecting dimensions, and binding them to chart types, a user types or speaks what they want to see, and the system handles the technical steps behind it.
This differs from a static dashboard template or a drag-and-drop editor. A template is fixed; a drag-and-drop editor still requires the user to know the data model and the builder interface. An AI dashboard builder removes both requirements: the system interprets intent, maps it to available metrics, and generates new metrics when an exact match does not exist in the workspace.
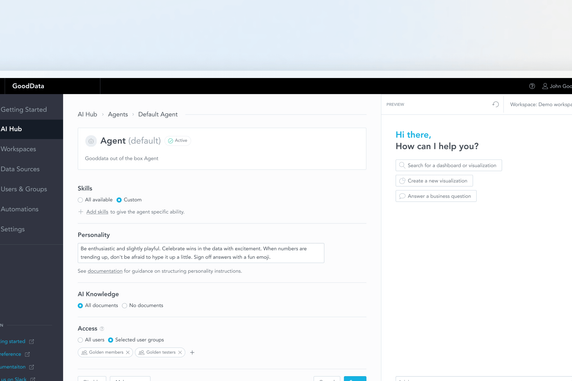
GoodData.AI ships this capability as Dashboard Builder Copilot. Any user with edit access can describe a dashboard in plain language and have the Copilot build it directly in the workspace.
How It Works: From Prompt to Live Dashboard
The mechanics behind an AI dashboard builder follow three steps: interpret the request, resolve it against the data model, and render the result as editable widgets.
Describing What You Want in Plain Language
A user writes a request such as "show revenue by region for the last four quarters, plus a breakdown of top customers by order volume." The Copilot parses this into discrete intents: a time-series metric, a dimension (region), a date range, and a ranked list. No query language or chart-type selection is required from the user.
How the Copilot Finds or Creates the Right Metrics
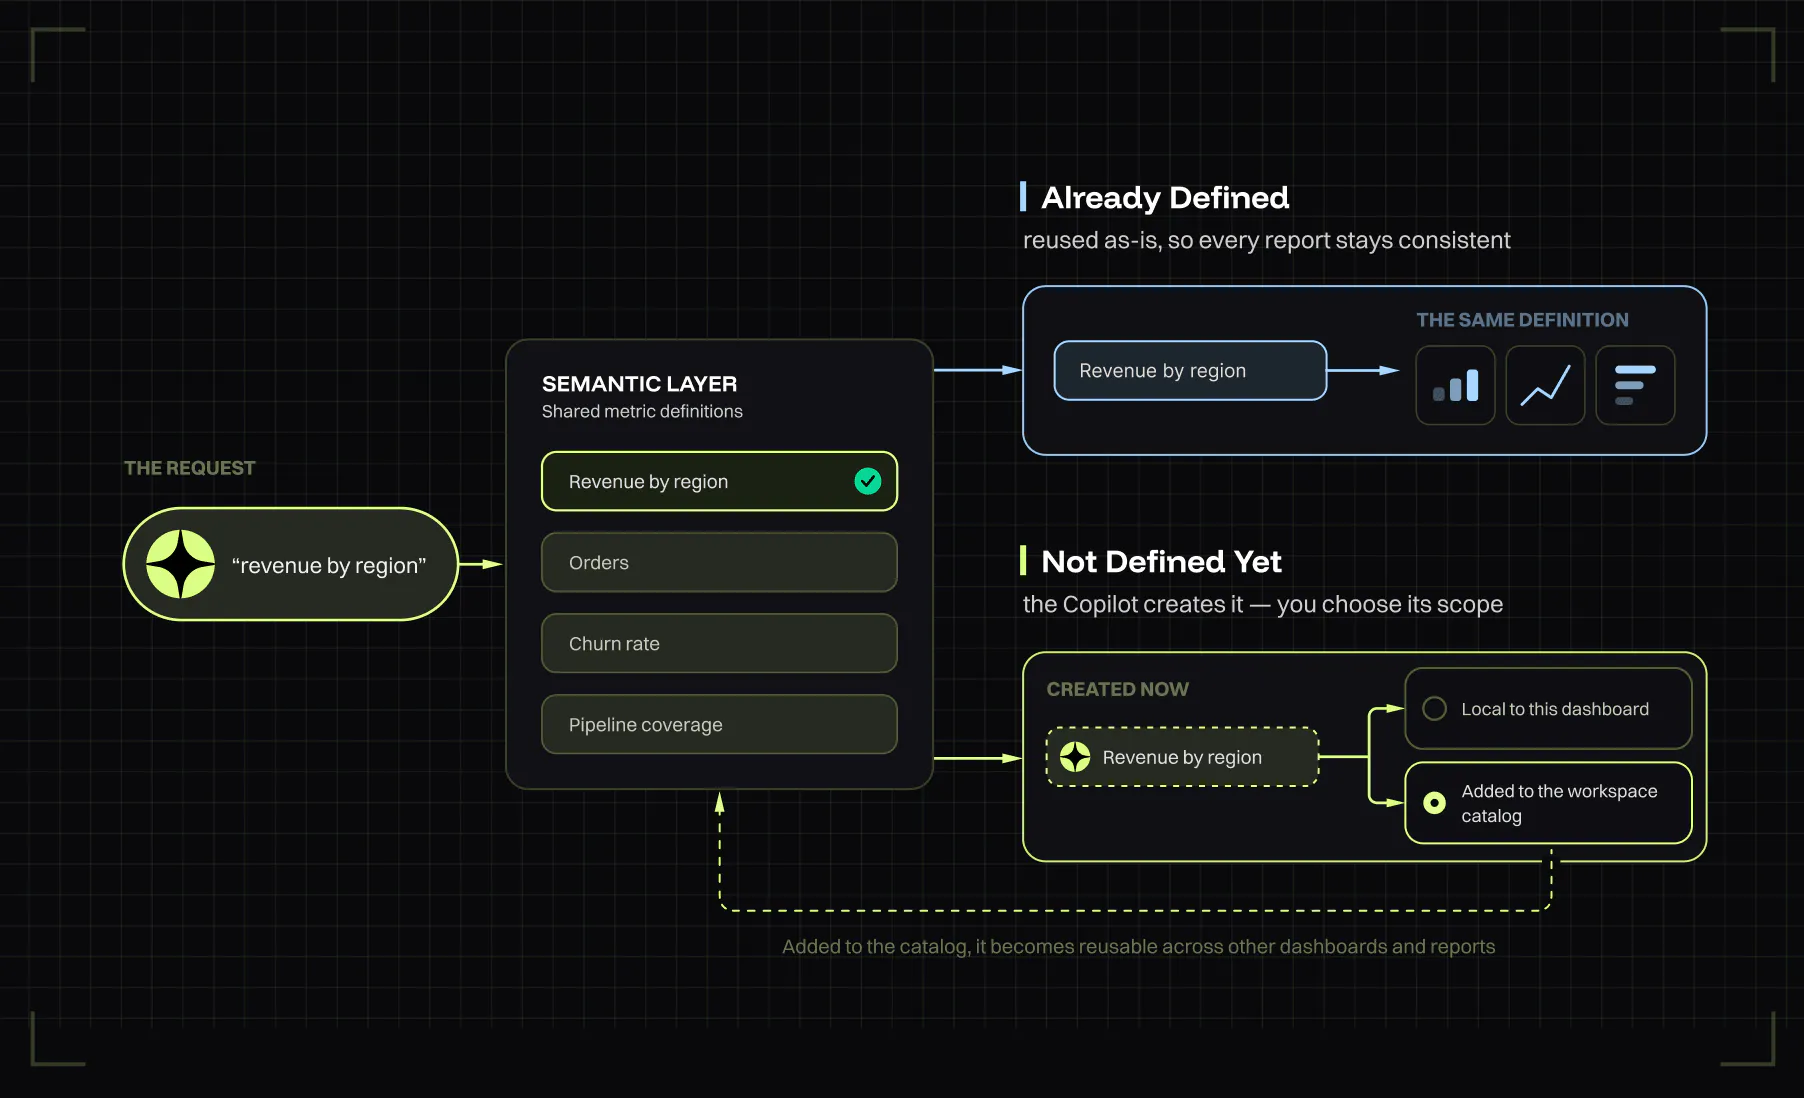
The system first checks whether the requested metric already exists in the workspace's semantic layer (a centralized business logic layer that maps raw data to business terms). If "revenue by region" is already defined, it reuses that definition to keep results consistent with every other report built on the same workspace. If no matching metric exists, the Copilot creates one. This matters for governance: ad hoc dashboards built by non-technical users still inherit the same metric definitions as the rest of the organization, instead of producing a parallel, unverified version of "revenue." When a new metric or visualization is created, the user decides its scope: it can remain local to the current dashboard, or be added to the workspace catalog and made reusable across other dashboards and reports.
Generating and Editing Dashboards: One-Shot and Iterative
Dashboard Builder Copilot supports two interaction modes, and the right one depends on where the user is in the workflow.
For a net-new dashboard, a single prompt is enough: describe what you want, and the Copilot generates the full dashboard at once, selecting or creating the relevant metrics and assembling the widgets. This is the same one-shot approach offered by other AI dashboard tools on the market.
Where GoodData.AI goes further is iterative editing of an existing dashboard. A user can open a dashboard that already exists and change any part of it through conversational commands: swap a visualization type, update a metric, rewrite a description, or restructure a section, without touching the underlying builder. This turns the Copilot from a generation tool into an ongoing editing interface, available whenever the dashboard needs to evolve.
Where This Fits in Embedded and Self-Service Analytics
An AI dashboard builder solves two distinct problems for two distinct users, and conflating them leads to the wrong feature scope.
Analytics Engineers are typically the ones translating business requirements into metrics, visualizations, and dashboards by hand. An AI dashboard builder reduces this to drafting and refining instead of building from a blank canvas, which shortens the time between a request and a usable first version.
Business users who can technically use a point-and-click builder often do not, because it requires familiarity with the data model and the interface itself. Their requests either go unmet or queue up behind an Analytics Engineer's other work. An AI dashboard builder gives this group a way to get a working dashboard without learning either the data model or the builder, while still keeping output governed by the same semantic layer used everywhere else in the platform.
For SaaS companies embedding analytics into their own product, this capability is available through GoodData.AI's SDK or web components, so the Copilot interface can sit wherever fits the embedding product, including an edge panel, a sidebar, or an iframe.
Getting Started with AI Dashboard Building
Dashboard Builder Copilot is available as part of the GoodData.AI AI add-on for workspaces with edit access. Teams evaluating it for an embedded analytics product can review the SDK and web component documentation to see how the Copilot interface integrates into an existing application, or request a demo to see the build flow on a live data model.
Frequently Asked Questions
Yes. GoodData.AI's Dashboard Builder Copilot finds the right metrics in the data model, creates new ones if they do not exist, and generates the corresponding widgets based on a plain-language description, without requiring the user to know the underlying data model.
Yes. The Copilot resolves requests against the workspace's existing semantic layer first, reusing already-defined metrics so generated dashboards stay consistent with reports built manually in the same workspace.
Yes. Beyond generating a new dashboard from a single prompt, Dashboard Builder Copilot lets users edit any part of an existing dashboard through plain-language instructions. A user can swap a visualization type, update a metric, rewrite a description, or restructure a section without opening the underlying builder. This means the Copilot stays useful after the initial dashboard is created, not just during the first build.
Yes. GoodData.AI's Dashboard Builder Copilot runs as an AI skill independent of the UI surface, so it can be embedded through the SDK, web components, or an iframe wherever it fits an existing SaaS product.
Analytics Engineers benefit from a faster path from a business requirement to a working draft, and business users without builder experience benefit from being able to get a dashboard without learning the data model or a point-and-click interface.
No. A chatbot-style conversational analytics tool answers a single question on the spot and moves on. Dashboard Builder Copilot is aimed at the artifact, not the conversation: it produces a saved, multi-widget layout that a team keeps coming back to, and it keeps working after the first build through iterative editing of any part of the dashboard.