Ask Your Data: Turn a Question Into an Instant Chart
4 min read | Published


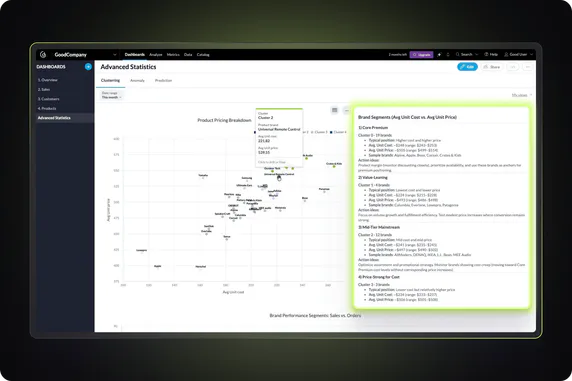
Most business questions about data still go through the same slow path: ask an analyst, wait for a report, get an answer that already feels out of date by the time it arrives. An interactive dashboard powered by AI removes that wait. You type a question in plain language, such as "show me sales of product A for the last quarter," and the system returns a chart on the spot, built from the same governed data your company already trusts. No dashboard has to exist first, and nothing has to be saved unless you want it to be.
Key Takeaways
- Asking your data a direct question returns an instant chart, without requiring a pre-built dashboard or a saved report.
- This is a different interaction model from building a dashboard: it produces a one-time answer, not a persistent multi-widget layout.
- GoodData.AI's AI Assistant generates a visualization directly from a business question, drawing on the same governed semantic layer used across the platform.
- The main beneficiary is speed: decisions that used to wait on an analyst's availability can happen as soon as the question is asked.
- This approach works for any user, including C-level and other non-technical roles, because it requires no knowledge of the underlying data model or query language.
What It Means to Ask Your Data Instead of Building a Dashboard
Asking your data means typing or speaking a business question and getting a visual answer immediately, without first creating a dashboard to hold it. This is different from traditional self-service business intelligence, where a user still has to open a builder, find the right fields, and configure a chart before seeing any result.
The distinction matters because most analytics tools were designed around the dashboard as the unit of work. A dashboard is built once and reused; building one is worth the effort when the question will be asked repeatedly. A direct question is often asked once, in the moment, to support a single decision. Forcing every question through a "build a dashboard first" workflow adds friction that has nothing to do with the value of the answer.
GoodData.AI's AI Assistant is built for this second case. A user types a business question in plain language, and the Assistant returns a visualization generated against the workspace's governed semantic layer (a centralized business logic layer that maps raw data to business terms), without requiring a dashboard to already exist.
How It Works: From Question to Visualization
The path from a typed question to a chart involves interpreting intent, resolving it against existing metrics, and rendering an answer, all within seconds.
Asking in Plain Language
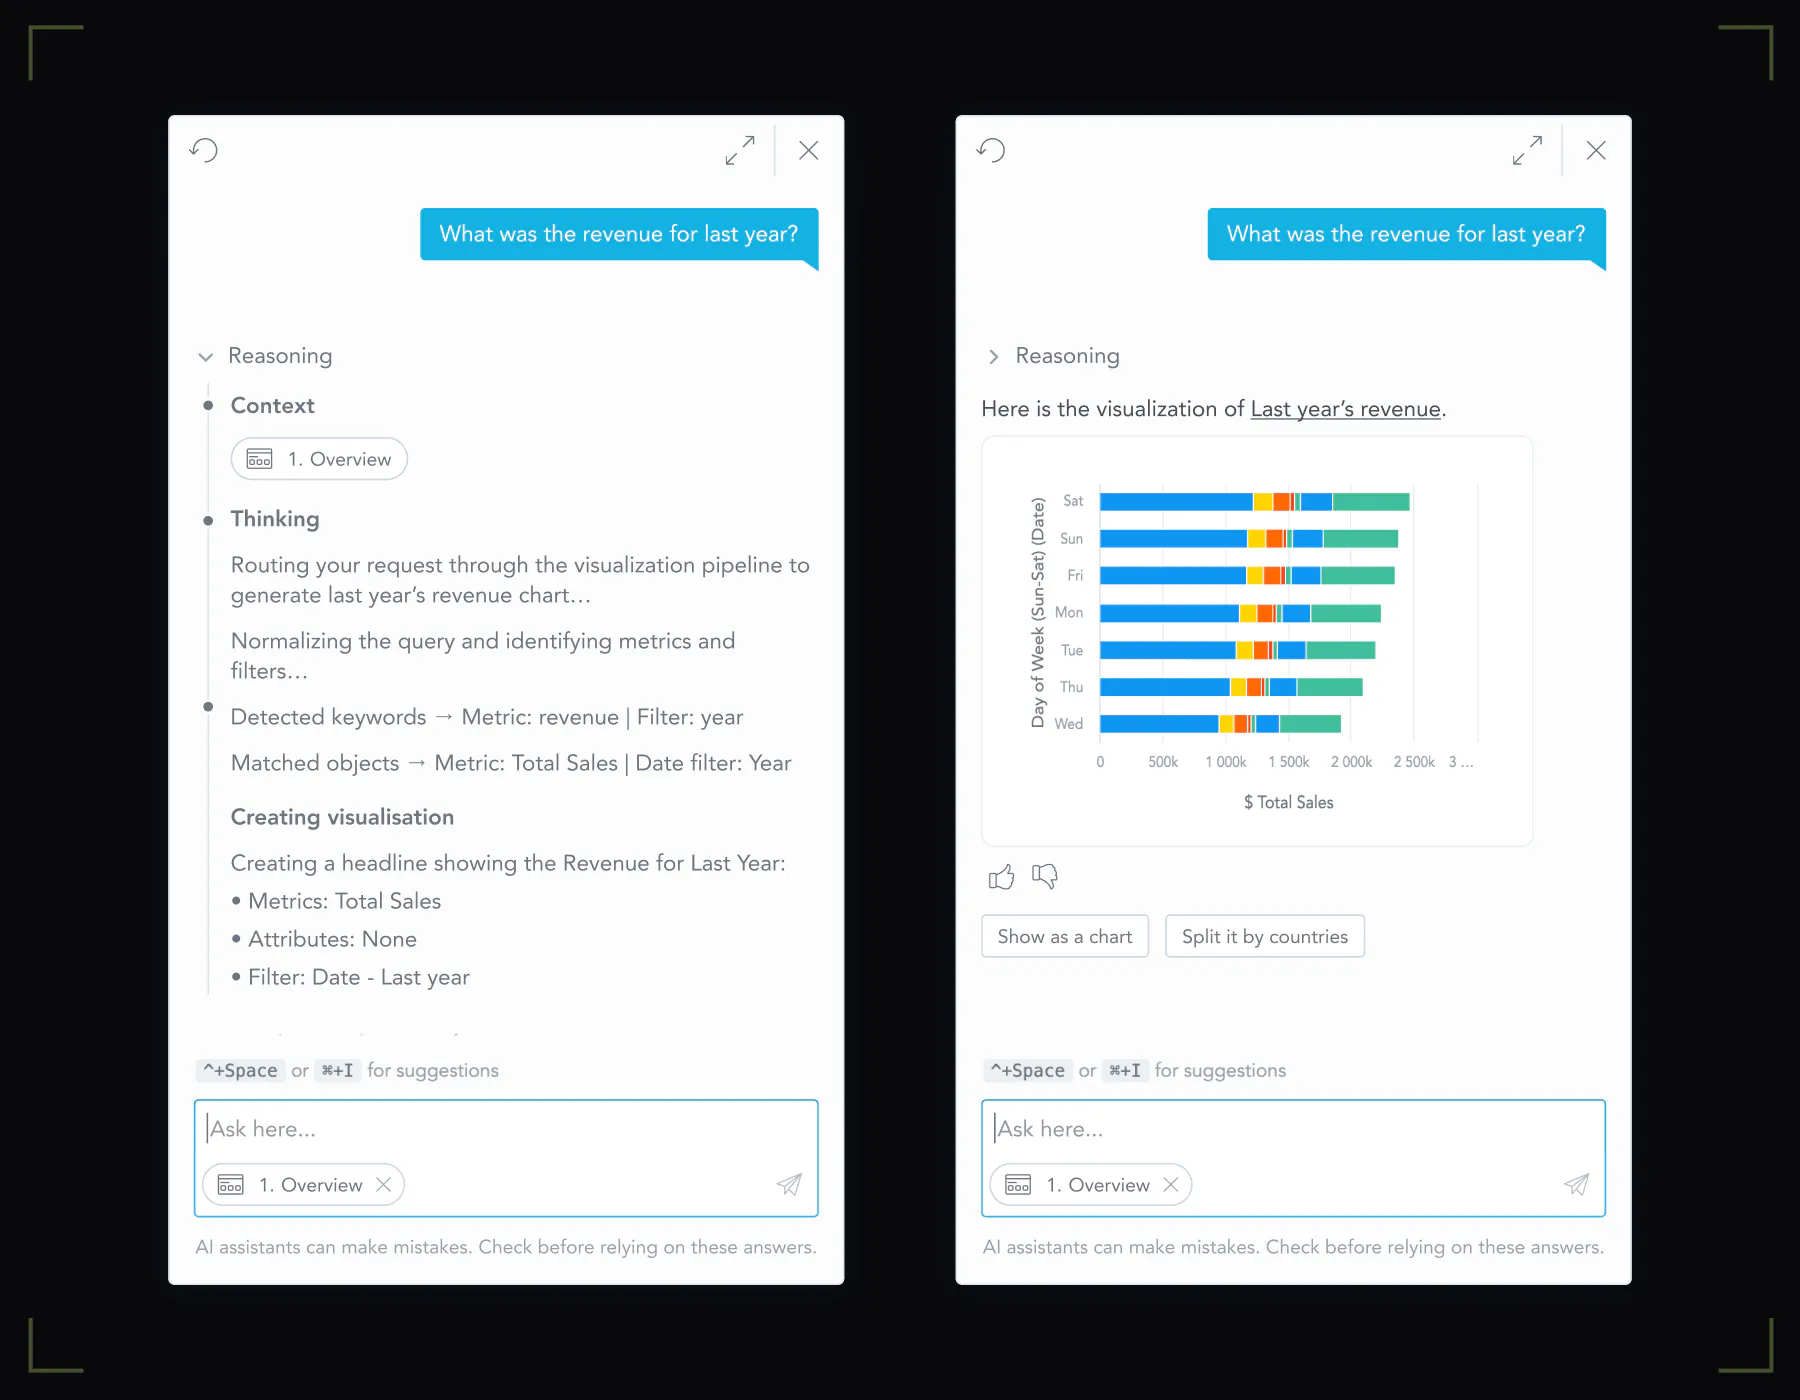
A request like "show me sales of product A for the last quarter" gets parsed into its components: a metric (sales), a filter (product A), and a time range (last quarter). The user does not select a chart type, write a query, or know which table holds the underlying data. The system infers a reasonable visualization automatically based on the shape of the data and the type of question asked.
Why the Answer Doesn't Need to Be Saved as a Dashboard
A visualization generated from a business question is a complete, standalone answer; it does not need to be added to a dashboard to be useful. This is a structural difference from dashboard building, not a missing feature. Today, GoodData.AI's AI Assistant creates visualizations directly from business questions but does not store them on a dashboard, and that gap is intentional rather than incidental: a one-off question and a reusable dashboard widget solve different problems and should not be forced into the same workflow. A user checking same-day sales for a single product does not need a saved artifact; a regional sales manager tracking the same metric every Monday does, which is exactly the case a persistent dashboard is built for instead.
Why Speed Changes Who Can Use Analytics
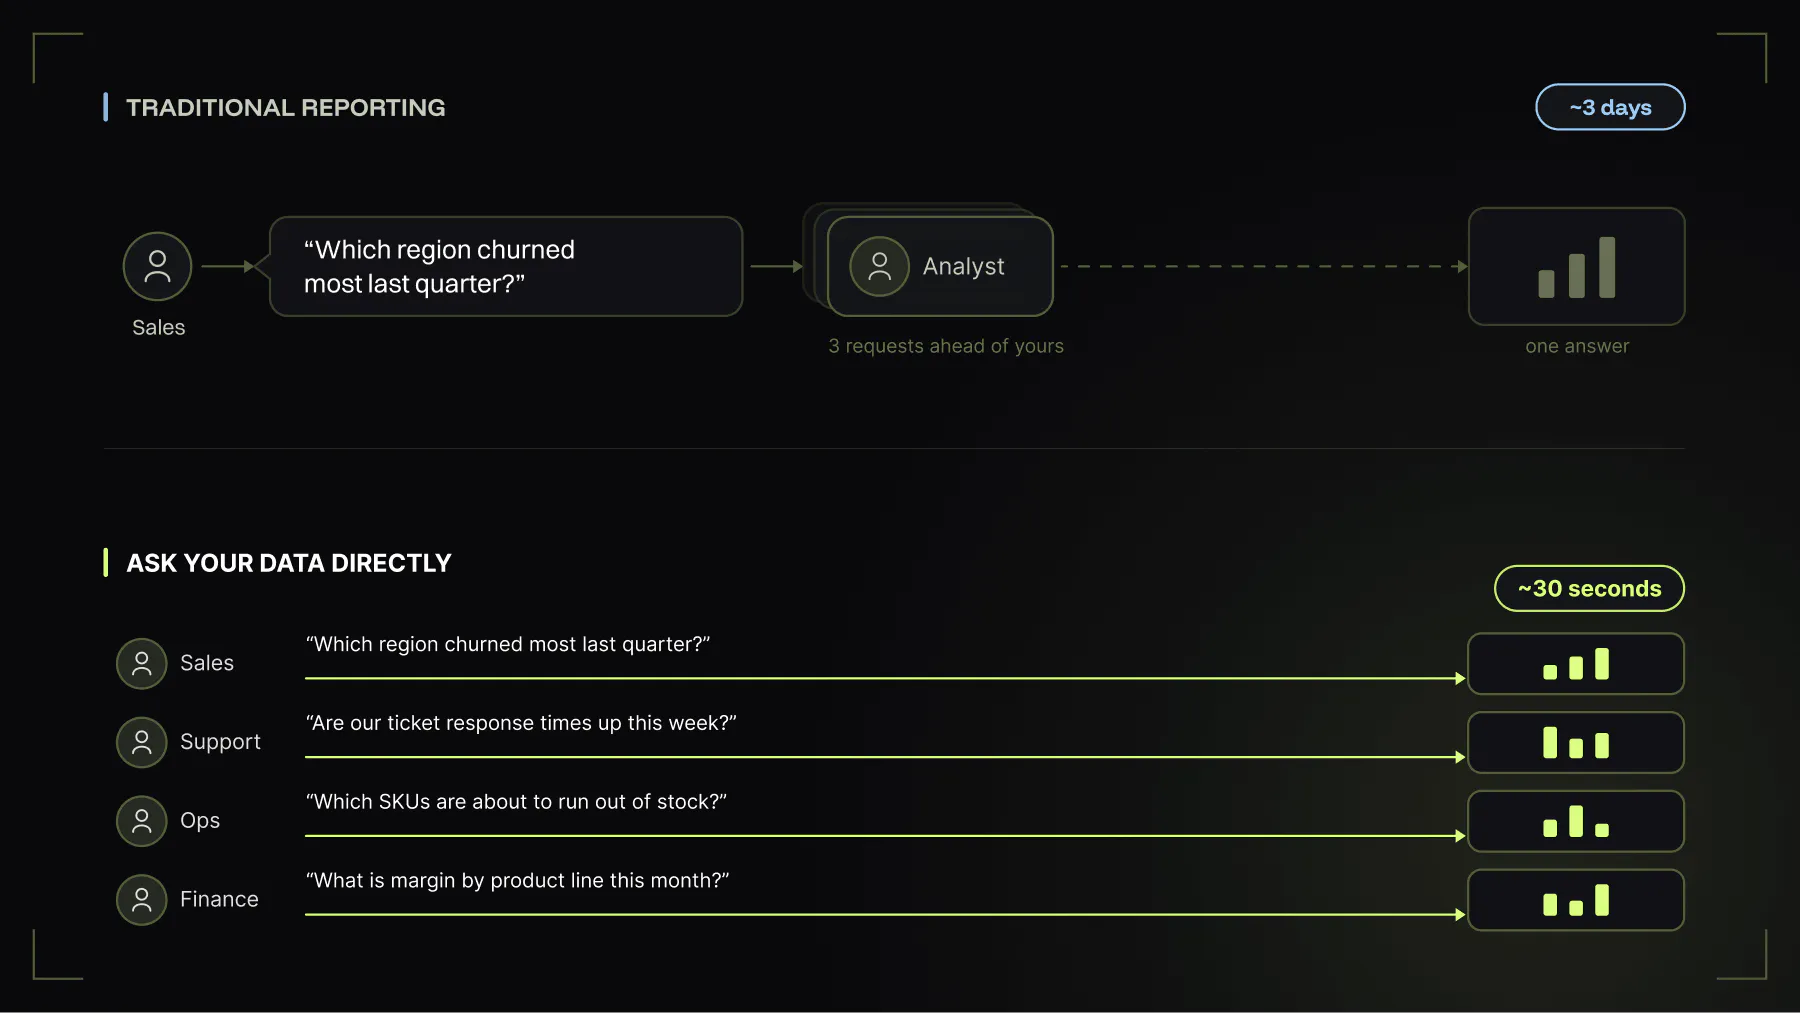
The value of asking your data directly is not the chart itself; it is who gets access to an answer and how fast they get it. A traditional reporting workflow puts an analyst between a question and its answer, which means the answer's usefulness depends on that analyst's availability, not just on how good the data is.
Removing that step changes who can act on data. A sales VP preparing for a same-day customer call does not need to file a request and wait; the VP can ask the question directly and get a governed answer immediately, drawing on the same metric definitions used everywhere else in the company. This matters most for non-technical roles, including C-level executives, because they are the group least likely to know a query language or a builder interface, and most likely to need an answer inside a meeting rather than after it.
Speed without governance is not a real advantage. Asking your data only replaces the slow path safely if the fast path still draws on the same trusted, centrally defined metrics as every other report; otherwise, faster answers just mean faster inconsistencies.
Ask Your Data vs. Building a Dashboard: When to Use Which
Both interaction models solve real problems, but they solve different ones, and choosing between them comes down to one question: will this be asked once, or asked the same way repeatedly?
| Situation | Better fit |
|---|---|
| A one-time question tied to a specific decision (a meeting, a call, an ad hoc check). | Ask your data directly for an instant answer. |
| The same metric needs to be checked on a recurring basis by one or several people. | Build a persistent dashboard so the answer is always available without re-asking. |
| The requester does not know the data model or wants no setup at all. | Ask your data directly. |
| The output needs to be shared, embedded, or viewed by a team over time. | Build a dashboard. |
These two approaches are complementary rather than competing. A question asked repeatedly enough to be worth saving is a strong signal that it should graduate into a dashboard.
Getting Started
GoodData.AI's AI Assistant is available to any user with workspace access and requires no setup beyond an existing governed data model. Teams evaluating it for faster, broader access to analytics can request a demo to see a live question answered in real time, or review the AI Hub overview to see how it fits alongside dashboard building and embedded analytics.
Frequently Asked Questions
No. You type or speak the question in plain language, such as "show me sales of product A for the last quarter," and the system interprets the metric, filter, and time range without requiring any query syntax.
The answer is generated against the workspace's existing semantic layer, reusing the same metric definitions used across dashboards and reports, so a direct question returns results consistent with the rest of the organization's analytics.
Yes. Any user with access to the workspace can ask a question directly, without needing to file a request to an analyst or learn a builder interface first.
No. A visualization generated from a direct question is a standalone answer and is not automatically added to a dashboard; if the same question needs to be checked regularly, it can instead be built into a persistent dashboard.
The two solve different jobs. Asking your data directly is built for the moment you have a question right now and need an answer before the next meeting starts. An AI dashboard builder is built for the moment you know you'll have the same question again next week, and want it waiting for you instead of re-asking it.
No. Asking your data directly is built for one-time or ad hoc questions, while recurring metrics that multiple people check on a regular basis are still better served by a persistent dashboard.