AI Agent Observability: Why It Belongs in Your Analytics Platform, Not a Separate Tool
6 min read | Published


An AI agent that books a meeting, updates a record, or triggers a workflow does not just risk a wrong answer. It risks a wrong action. AI agent observability, sometimes called agentic AI observability, is the practice of tracking what an agent actually did, step by step, so a bad outcome is a traceable bug instead of a mystery. This guide covers what agent observability means, how it differs from LLM observability, the tracing standards behind it, and why the platform where your agents already run is often the fastest place to get it.
For a broader overview of AI observability across LLMs, agents, and usage governance, see What Is AI Observability? A Practical Guide.
Key Takeaways
- AI agent observability tracks an agent's execution path, not just its final output: which tools it called, what data it retrieved, and how many steps it took.
- Agents fail differently from single-call LLM applications because they chain multiple decisions together, so one wrong step compounds into a wrong action.
- OpenTelemetry's emerging GenAI Semantic Conventions provide a vendor-neutral foundation for tracing model calls, agents, tool use, retrieval, and other GenAI operations, while additional conventions for areas such as memory and agent lifecycle are still evolving.
- Bolt-on observability tools often lack the usage and workspace context that the platform running the agent already has.
- Start observability with instrumentation and evaluation gates before an agent goes into production, not after the first incident.
What Is AI Agent Observability?
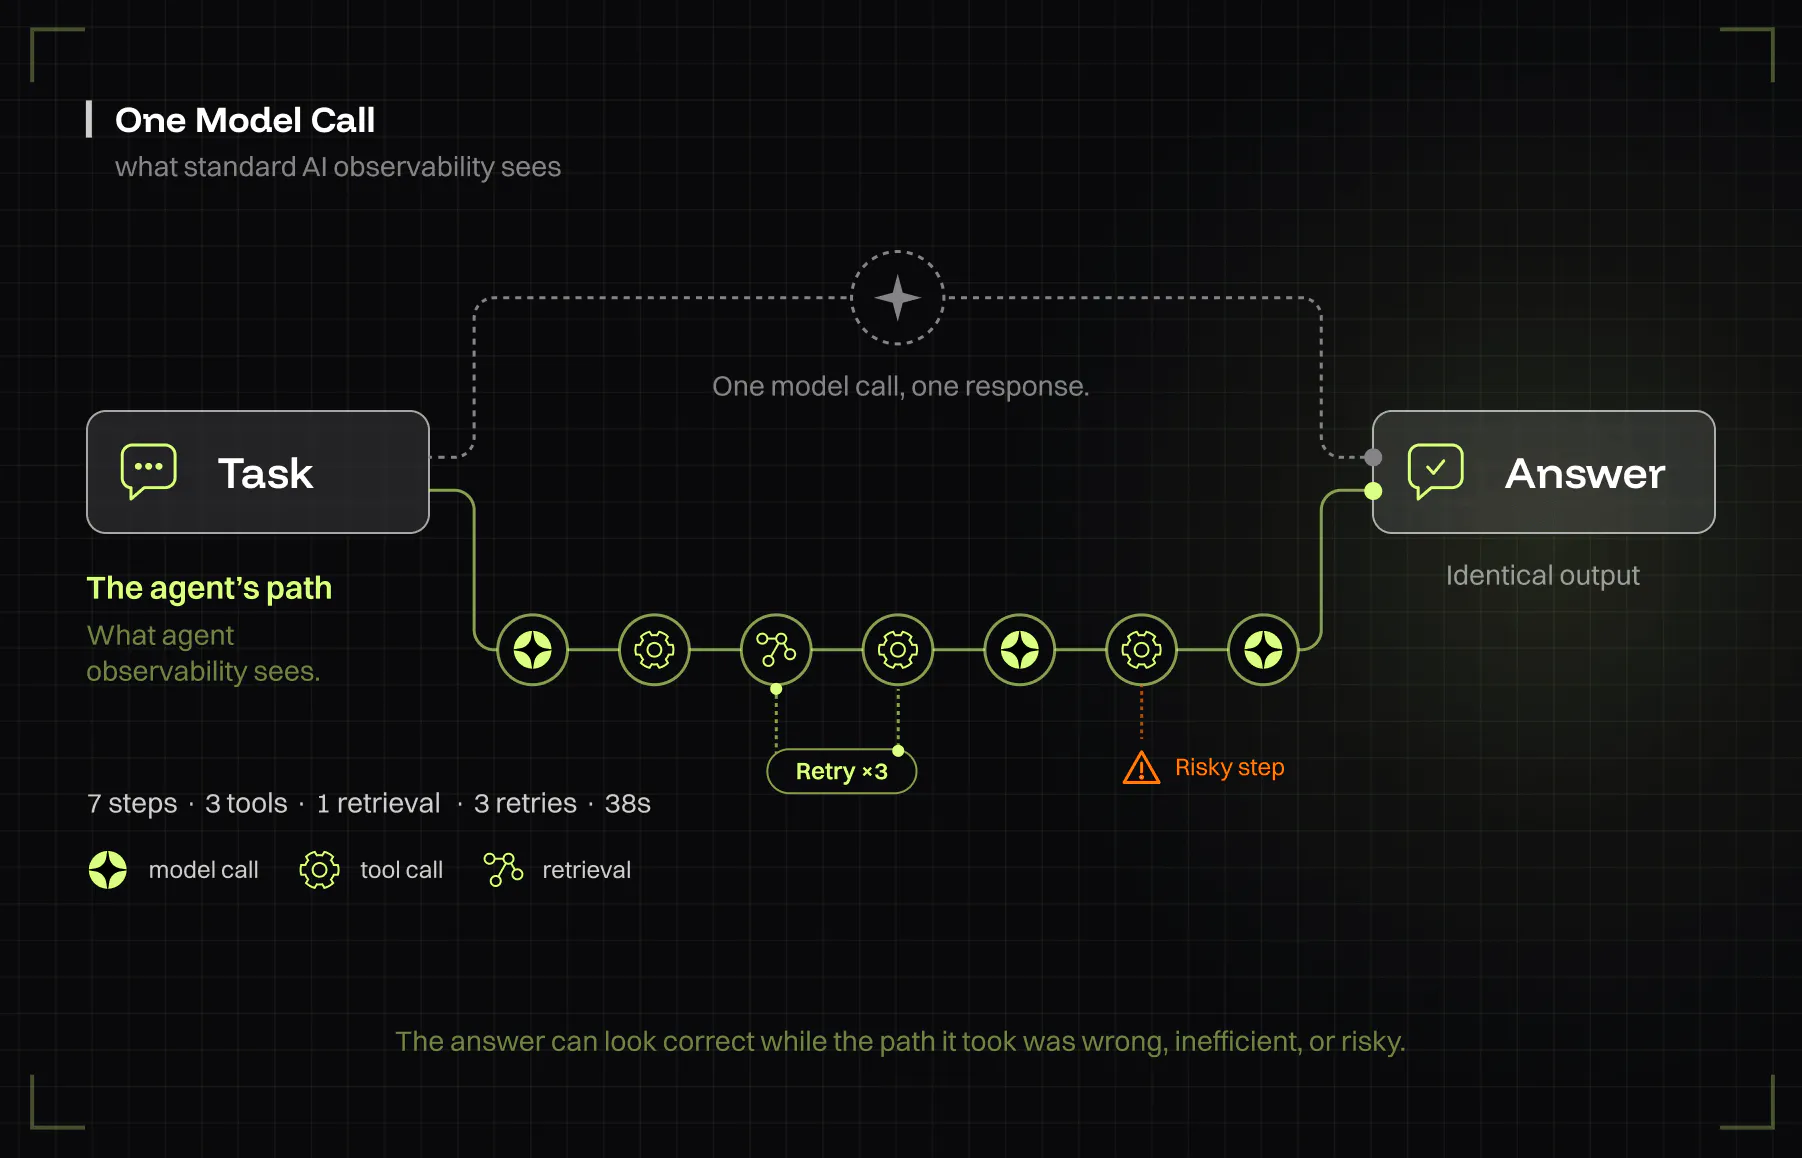
AI agent observability is the ability to see what an AI agent did internally while completing a task: which tools it called, what data it retrieved, how it reasoned between model calls, retrievals, and tool calls, and how many iterations it took to reach an outcome. It goes further than standard AI observability, which can stop at tracking a single model call, because an agent's output is the product of a chain of decisions, not one response.
This distinction matters because an agent's final answer can look correct while the path it took to get there was wrong, inefficient, or risky. A support agent that eventually gives the right refund amount but got there by calling the wrong customer's record first is not a success story; it is an incident that has not been noticed yet.
Why Agent Observability Differs from LLM Observability
LLM observability tracks a single call to a language model: the prompt, the completion, token usage, and latency for that one exchange. Agent observability tracks everything around that call: which tool the agent decided to use, what it retrieved before generating a response, whether it looped back to try again, and how the pieces chain together into a final action.
The practical difference shows up in debugging. If a single LLM call returns a wrong answer, the problem may lie in the prompt, retrieved context, model configuration, or application logic. If an agent takes a wrong action after five steps, the fix could live in any one of those five steps, and without a trace of each one, a team is reduced to reproducing the failure by hand and guessing where it went wrong.
Agents also introduce failure modes LLM calls alone do not have: looping on the same tool without making progress, selecting the wrong tool for a task, or losing track of context across a long chain of steps. None of these show up in a model-level trace that only captures the final input and output.
Core Pillars: Tracing, Tool Calls & Multi-Step Reasoning
A working agent observability practice rests on three technical building blocks that map onto how agents actually execute tasks. These map onto the broader traces-evaluations-metrics framework used across AI observability generally: traces record what happened, evaluations score whether it was good, and metrics aggregate both into trends a team can watch over time. For agents specifically, tracing carries most of the weight, since a single wrong step can compound into a wrong action.
Tracing the Full Decision Path
A useful agent trace typically contains multiple related spans representing model invocations, tool calls, retrievals, and orchestration steps in the order they occurred. This lets a team reconstruct exactly what the agent did, not just what it eventually returned. OpenTelemetry's GenAI Semantic Conventions already define standardized attributes for GenAI operations, while additional agent- and workflow-specific conventions continue to evolve across OpenTelemetry and the broader observability community.
Tool Calls as First-Class Events
Every time an agent calls a tool, whether it is a database query, an API call, or another agent, that call is a discrete event worth tracing on its own: what was called, what arguments were passed, what came back, and how long it took. Emerging GenAI conventions increasingly treat tool execution as a first-class observable operation, including the tool invoked, relevant arguments and results, duration, and errors. Without this level of detail, a failed task shows only that something went wrong, not which tool call caused it.
Multi-Step Reasoning and Memory
Agents that plan across multiple steps, or that draw on memory from earlier in a conversation, need their state tracked as it changes, not just at the start and end of a task. Community proposals are also exploring conventions for observing memory operations and agent lifecycle state, but these areas are less mature than core model and tool-call telemetry. This is what makes it possible to answer "at which step did the agent's reasoning go wrong," rather than only "did the agent get the right answer."
Discover how GoodData.AI helps you build, govern, and scale analytics, AI, and agents from one platform.
Request a demo
Why Bolt-On Observability Tools Miss Context Your Analytics Platform Already Has
Most AI agent observability tools are built to instrument an agent from the outside: add an SDK, route traces to a new backend, and view them in a new dashboard. That works, but it starts from zero. It does not automatically have application-specific context such as the user's workspace, permissions, semantic model, or tenant unless that context is explicitly instrumented and passed into the observability system.
An analytics platform that runs the agent is often much closer to that context because it already manages concepts such as users, workspaces, permissions, and the semantic model. Adding observability at that layer means a trace does not just show what a tool call returned; it shows what that call meant in the context of the workspace's data and the user's role.
This is also a practical argument, not just an architectural one: every additional tool adds authentication, data replication, and a dashboard to check. For a full breakdown of what that adds up to and when it is worth paying anyway, see AI Observability Tools: Do You Need a Separate One?. For a team already running agents inside an analytics platform, the fastest path to agent observability is usually checking what that platform already surfaces before adding a new one.
This does not mean a dedicated observability tool is never the right call. Teams building custom agents entirely outside any existing platform, with no system already holding usage or workspace context, are exactly the case where a dedicated tool earns its place. The decision point is whether that context already exists somewhere your agent runs.
AI Agent Observability Best Practices
Instrumenting an agent well from the start is far cheaper than retrofitting it after a production incident. These practices cover the sequence most teams follow.
Instrument before launch, not after the first incident. Wire up tracing using a standard like OpenTelemetry GenAI Semantic Conventions before an agent goes into production, so the first failure comes with a trace instead of a support ticket and a guess.
Trace every tool call, not just the final output. A trace that only captures the agent's last message hides exactly the information needed to debug a wrong action: which tool was called, in what order, and with what result.
Set evaluation gates before scaling usage. Automated evaluation scores or human review on a sample of interactions catch quality regressions before they reach every user, rather than after enough complaints accumulate to notice a pattern.
Treat prompts, responses, tool arguments, retrieved content, and agent memory as potentially sensitive telemetry. Capture them only when needed, apply appropriate redaction and access controls, and avoid indiscriminately indexing large raw payloads.
Alert on behavior anomalies, not just errors. An agent that loops on the same tool call five times, or that suddenly takes twice as many steps to complete a routine task, has not thrown an error, but it is a signal worth catching before it becomes one.
Track cost and iteration count per agent, not just in aggregate. A single misbehaving agent can quietly dominate token spend or iteration count; per-agent breakdowns catch this long before it shows up as a surprise on the monthly bill.
How GoodData.AI Approaches This Today
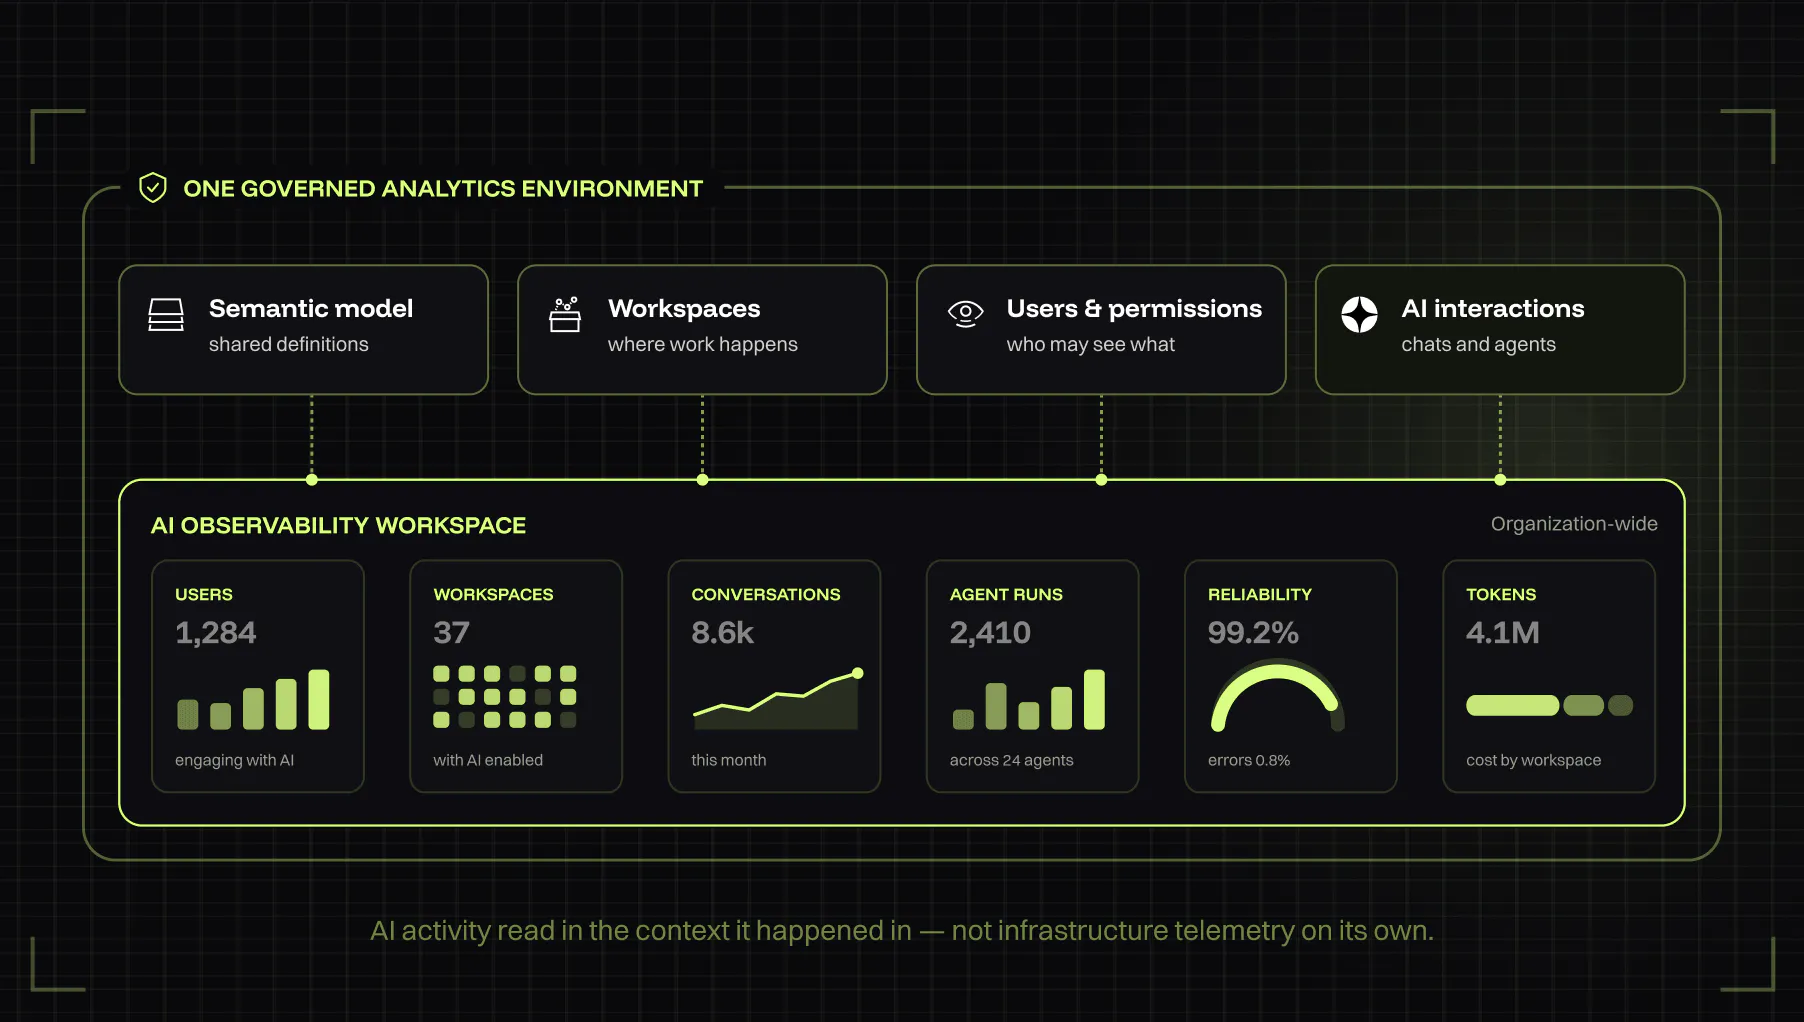
GoodData.AI treats observability as part of the same platform that runs analytics, data apps, assistants, and agents together, not a separate system to configure and maintain. Because they all share the same semantic model and governance layer, debugging a failed agent task surfaces who was affected, what data was involved, and how that ties back to the rest of the organization's analytics, not just what one tool call returned. Reliability issues, token consumption, and inconsistent agent behavior show up alongside the reporting teams already use, managed as part of the platform rather than a separate stack to run.
Where to Go From Here
Agent observability is not just LLM observability with more steps. It requires tracing the full decision path, treating every tool call as a traceable event, and having enough context about the workspace and data an agent touched to tell whether an action was right, not just whether it ran without an error.
Before adding a dedicated observability tool, check what your existing analytics or agent platform already surfaces. For the wider picture, see What Is AI Observability? A Practical Guide; for how agent usage ties into governance and cost accountability, see AI Governance Starts with Knowing Who's Using AI.
If your team is weighing whether to add a dedicated agent observability tool, see how GoodData.AI's agentic analytics platform surfaces AI usage out of the box, or request a demo to see it in action.
Discover how GoodData.AI helps you build, govern, and scale analytics, AI, and agents from one platform.
Request a demo
Frequently Asked Questions
LLM observability commonly focuses on model interactions such as prompts, responses, tokens, latency, and quality. Agent observability extends that view across the sequence of model calls, retrievals, tool calls, and iterations involved in completing a task.
Start with tool calls and their outcomes. Knowing which tools an agent called, in what order, and what each one returned usually explains a failure faster than capturing every possible execution detail.
OpenTelemetry's GenAI Semantic Conventions are the emerging vendor-neutral standard for this, with community-proposed extensions specifically for agent lifecycle, tool calls, and memory operations. Using a standard schema avoids locking telemetry into one vendor's proprietary format.
Not automatically. If your agents already run inside a platform that has usage, workspace, and data context, check what that platform surfaces before adding a separate tool. Dedicated tools make the most sense for agents built entirely outside any existing platform.
Output is the final answer or action an agent produces. Behavior is everything that led to it: which tools it called, what data it retrieved, and how many steps or iterations it took. An agent can produce a correct output through an inefficient or risky behavior path.
An agent taking the wrong action, not just giving a wrong answer. Once an agent can update records or trigger workflows, an unobserved failure in its decision path can have consequences beyond a bad response on a screen.