What Is Multi-Tenant Analytics? Security, Setup & AI Agents
9 min read | Published
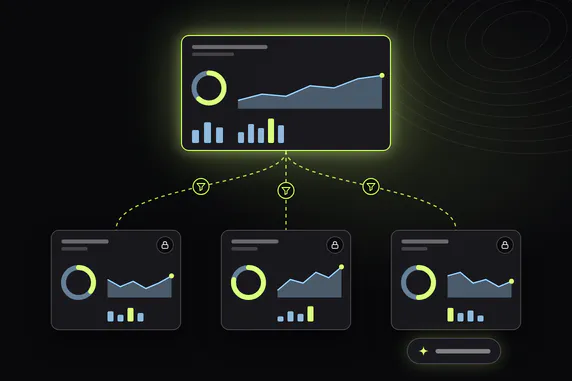

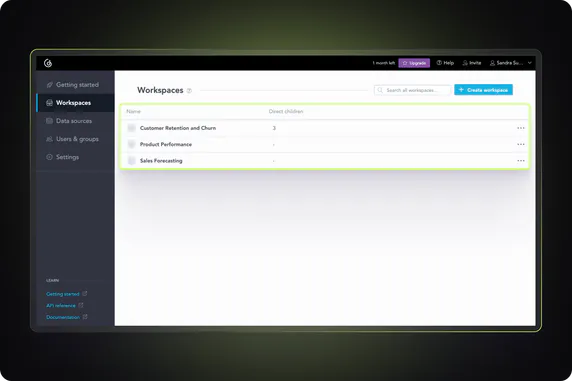
Multi-tenant analytics is a way to deliver dashboards and reports to many separate groups of users, called tenants, from one shared analytics setup, while each tenant sees only its own data. The typical case is a SaaS company that shows every customer a usage dashboard inside its product: one set of metrics and dashboards for hundreds of customers, none of whom can see another customer's numbers.
Multi-tenant analytics is the analytics side of a multi-tenant architecture. The hard part isn't drawing the charts. It's keeping definitions shared and data separate as the number of tenants grows. The same rules then have to hold for every way a tenant reaches its data: a dashboard, an exported report, and, more and more often, an AI assistant or agent that answers questions on a user's behalf.
Key Takeaways
- Multi-tenant analytics serves many tenants (customers, partners, or business units) from one analytics setup and limits each tenant to its own data.
- The common pattern is a parent workspace with the shared data model, metrics, and dashboards, plus one child workspace per tenant that inherits them.
- Data access works in three layers: a filter that scopes each tenant's workspace, row-level security that scopes individual users inside it, and object-level permissions that decide which columns, metrics, visualizations, and dashboards each user can use.
- Shared definitions are the main benefit: a metric changed once reaches every tenant, and each tenant can still add its own reports.
- AI assistants and agents must query with the end user's identity, so the same tenant filters and permissions apply.
- Cost grows with tenants, users, and query load, so caching and per-tenant limits matter as much as licensing.
How Does Multi-tenant Analytics Work?
Multi-tenant analytics works by giving each tenant its own analytics environment that is built from shared definitions and filtered to that tenant's data. In GoodData.AI, this environment is a workspace: it holds users and their permissions, the connection to data, the logical data model, metrics, visualizations, and dashboards.
Organizing workspaces into a workspace hierarchy is the most common way to build a multi-tenant environment. The hierarchy is a tree of parent-child relationships with two types of workspace:
- Parent workspace: the template for its children and the central point for managing them. It holds the data model, metrics, and dashboards that child workspaces inherit. End users usually don't get access to it.
- Child workspace: where a customer, partner, or team works with its dashboards. It inherits the data model, metrics, and dashboards from the parent as read-only content. Each child can add its own metrics and dashboards, which never reach the parent or other tenants.
A change made in the parent workspace reaches every child workspace, so a new metric or a fixed dashboard goes to all tenants at once. Adding tenants scales the same way: you can create child workspaces one at a time or define dozens or hundreds of them at once through the declarative workspace layout API, as the Create a Multitenant Environment guide shows.
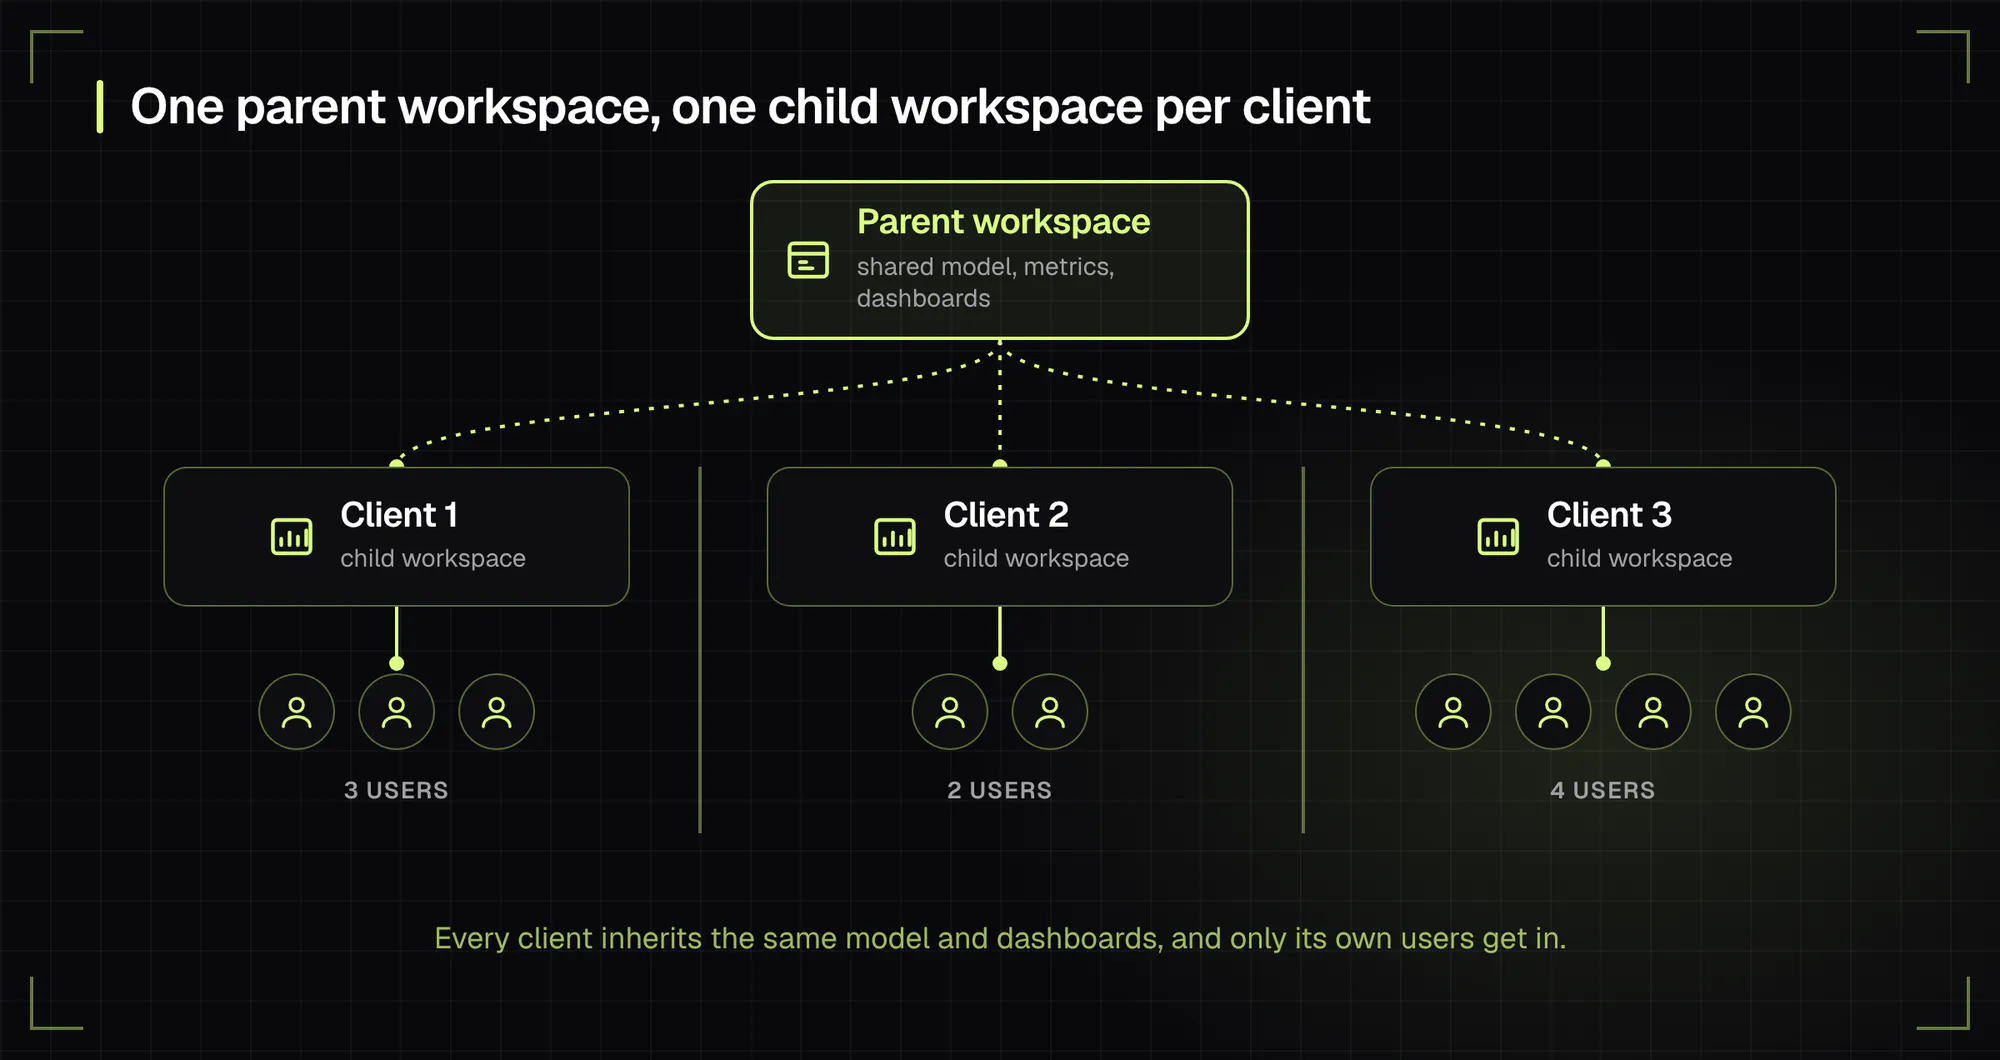
Workspace hierarchy structure
When groups of tenants need fundamentally different metrics, for example, two product lines built on different data, organize workspaces into segments. Each segment is a separate hierarchy with its own parent workspace, its own data model, and one or more child workspaces.
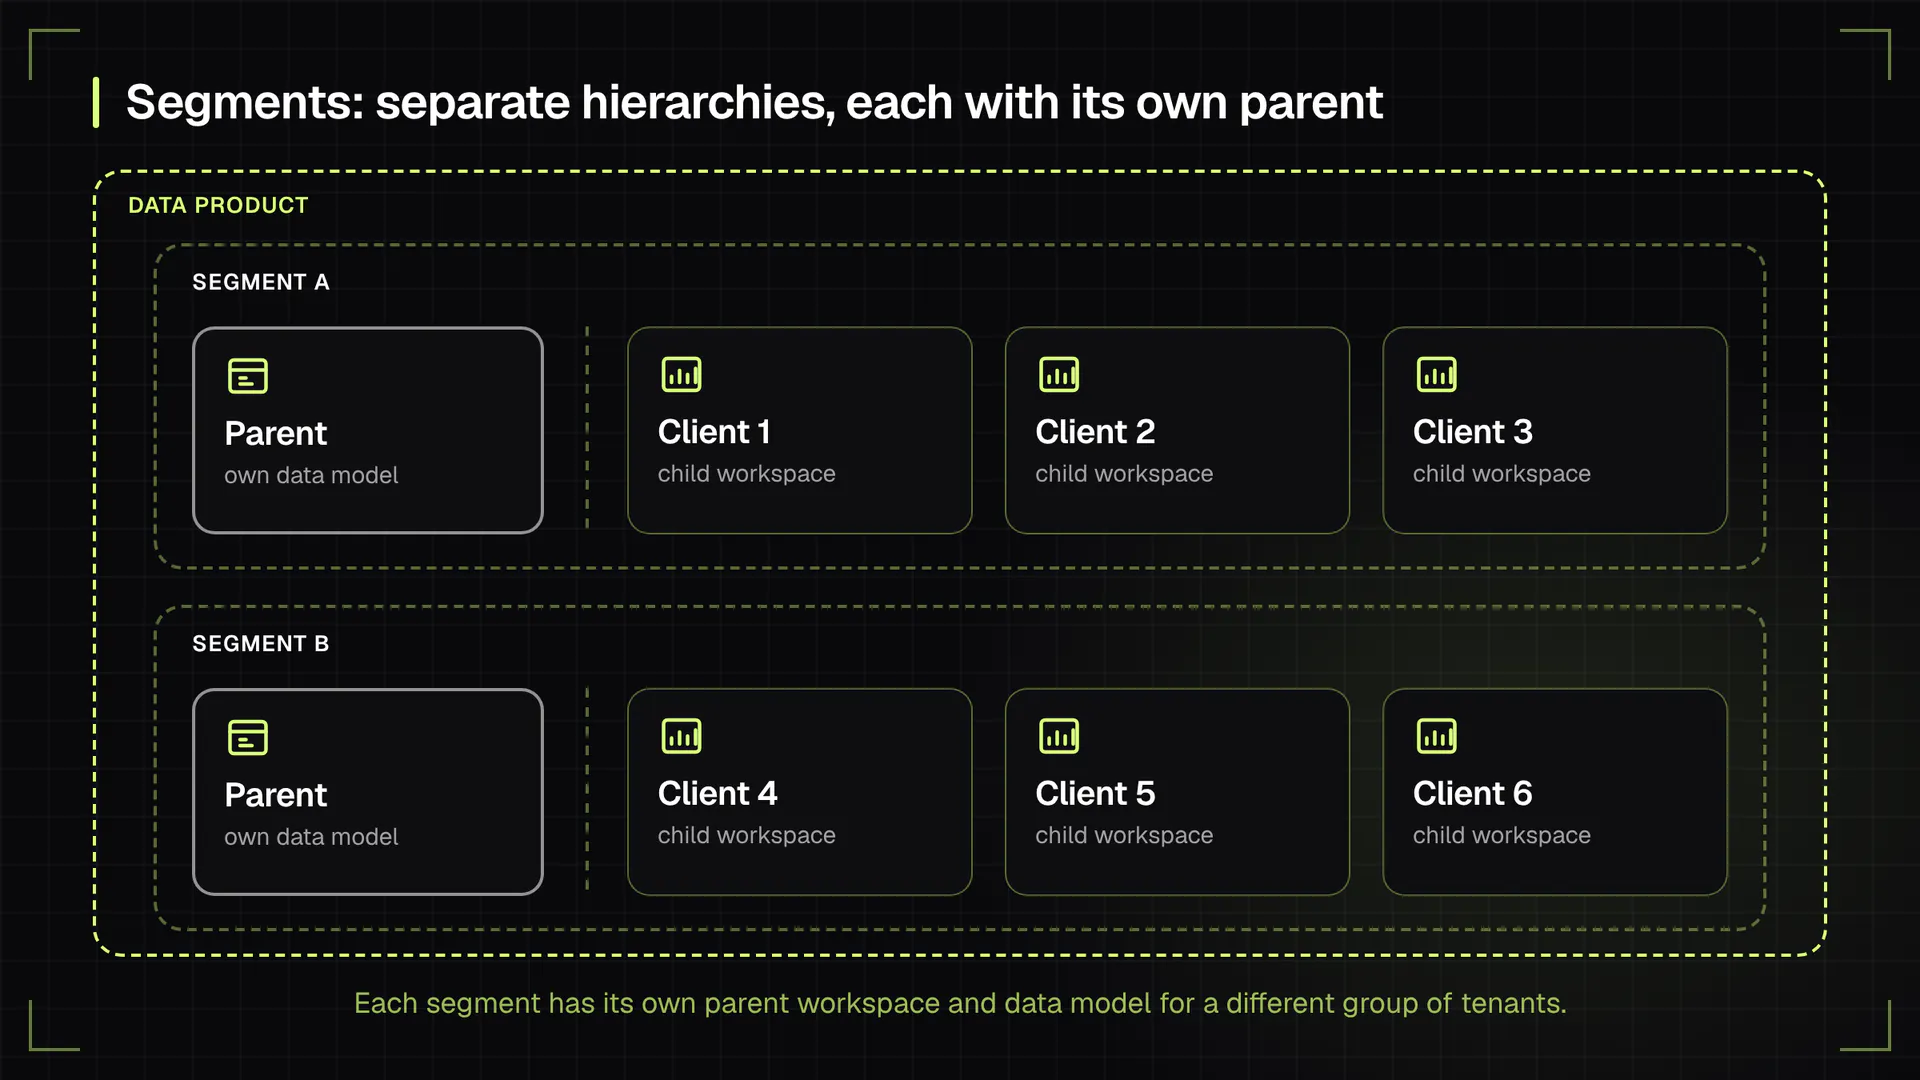
Workspaces organized into segments
How does each tenant see only its own data?
Each tenant sees only its own data because every query in its workspace is filtered to that tenant, either in a shared data model or through a separate data source. The same two patterns appear across embedded analytics tools: Microsoft's Power BI Embedded security guidance, for instance, describes one shared model filtered by row-level security for smaller customer bases and a separate workspace per customer for independent software vendors (ISVs) with thousands of customers.
In GoodData.AI, workspace data filters do this for child workspaces. A workspace data filter points to a column, such as a customer ID or a region, and each child workspace gets its own value. Child workspaces inherit the filter definition from their parent, and in deeper hierarchies each level can only narrow the values its parent allows. Once a filter is defined, a child workspace without an assigned value gets no data rather than all data. When a tenant's data has to stay physically separate, for example, because of a contract, the tenant can have its own data source instead.
For example, a company with branches in the US, France, and Japan can create one child workspace per branch and filter each by location. Every branch tracks its own performance with the same metrics, and headquarters changes a definition once for all three.
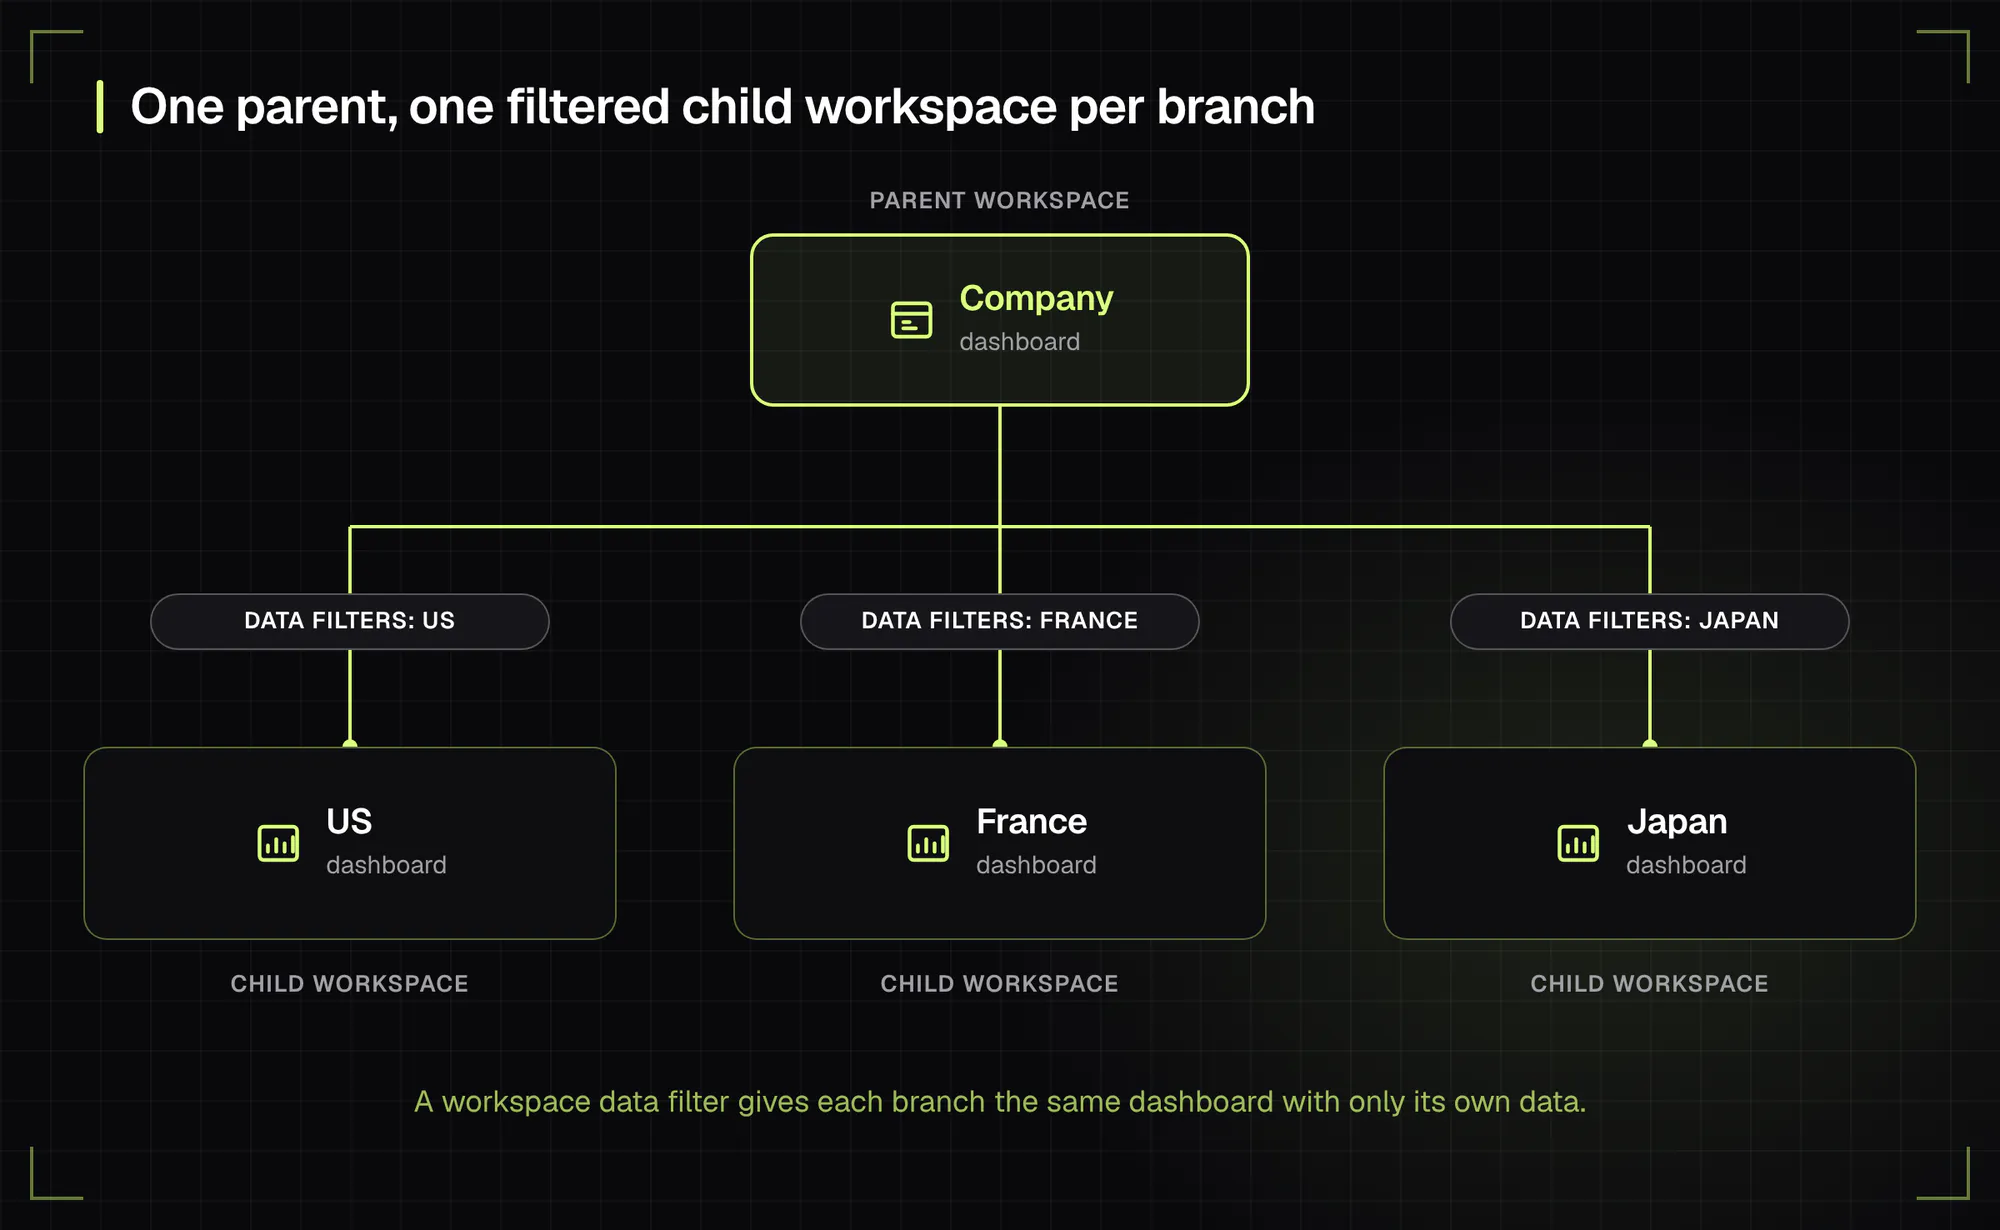
Filtered data for different branches
Can each tenant have its own dashboards and branding?
Yes: tenants share the core and own their extras. Each child workspace can add metrics and dashboards on top of the inherited ones without affecting the parent or other tenants. When analytics is embedded in your product, white-labeling replaces the vendor's look with yours through custom themes, color palettes, and your own domain, so customers see your brand, not GoodData.AI's.
The same pattern extends beyond dashboards. With AI Reports in GoodData.AI, you build a branded report template once in the parent workspace, and every child workspace gets it rendered with its own data and branding, ready to export as PDF or editable PowerPoint. Each customer's copy can then be tailored, with AI drafting the takeaways from that customer's data. Scheduled, personalized exports and alerts reach each tenant by email, in-app notification, or webhook under the same governance.
Experience GoodData in Action
Fully managed, multi-tenant analytics platform. Get instant access — no installation or credit card required.
Explore product toursSingle-Tenant vs. Multi-Tenant Analytics
Single-tenant analytics gives each customer a separate analytics deployment, while multi-tenant analytics serves all customers from one shared setup with per-tenant workspaces. The difference shows up most when definitions change and when new customers arrive.
| Single-tenant analytics | Multi-tenant analytics | |
|---|---|---|
| Setup per customer | A separate deployment, data model, and dashboards | One shared data model and dashboards, one workspace per customer |
| Changing a metric | Repeated in every copy | Made once in the parent, inherited by every tenant |
| Data separation | Separate instances and databases | Workspace data filters, row-level security, or a data source per tenant |
| Onboarding a customer | Build or copy a new environment | Create a child workspace and assign its filter value |
| Customization | Anything, per customer | Shared core plus each tenant's own metrics, dashboards, and branding |
| Best fit | A few large customers with unique needs or strict separation rules | Dozens to thousands of customers with similar analytics needs |
Many SaaS companies combine both: a shared multi-tenant setup for most customers and a dedicated deployment for the few that require one.
What Is Security in Multi-tenant Analytics?
Security in multi-tenant analytics means that every query, from every user or agent, is limited to the data that the user, and the user's tenant, may see. Sign-in alone doesn't achieve that. The AWS SaaS Architecture Fundamentals whitepaper points out that a user can be authenticated and authorized and still reach another tenant's resources, unless the system applies the tenant context to every access.
Multi-tenant analytics security therefore works in six layers:
- Users and user groups: each person signs in, ideally through the company's identity provider with single sign-on (SSO), and belongs to the user groups of their tenant.
- Permissions: decide what each user or group may do in a workspace, such as view dashboards, analyze data and create metrics, or manage the workspace.
- Object-level permissions: decide who can view, share, or edit individual metrics, visualizations, and dashboards. An object set to Restricted is visible only to the users and groups it is shared with, so a tenant's draft metrics or internal dashboards stay private even inside its own workspace.
- Column-level security: column-level permissions restrict selected columns of the data model, such as facts, attributes, and labels, to specific users and groups. A user without access to a column, such as margin or salary, can't see or query it, and the AI Assistant follows the same rules (in beta).
- Tenant data isolation: workspace data filters, or a separate data source per tenant, keep each workspace on its tenant's data.
- Row-level security: user data filters restrict data further for individual users or groups inside a workspace, for example, a regional manager who sees only her region. They are written in MAQL, the GoodData.AI metric query language, and when several filters apply to a user, the user sees only the data that all of them allow.
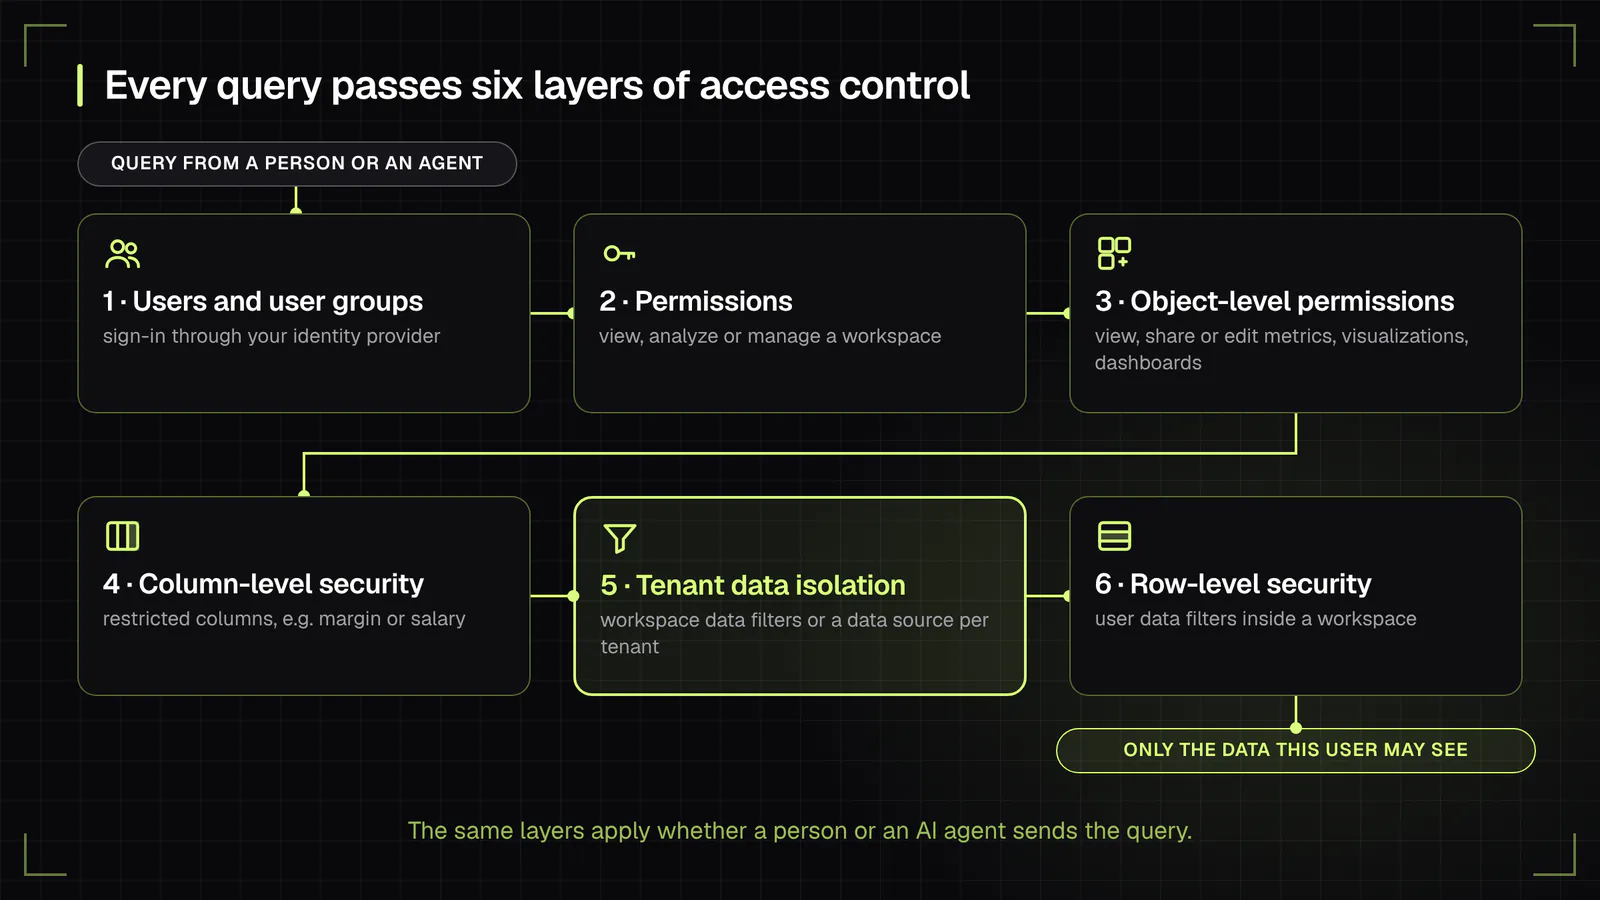
Security in Multi-tenant Analytics
For example, a company can give its sales team a workspace where one user group may only view dashboards, and give marketing a workspace with two groups: Marketing Analyze, which explores data and creates metrics, and Marketing View, which only views dashboards. An analytics team with the Analyze permission in the parent workspace maintains the shared dashboards that both departments inherit.
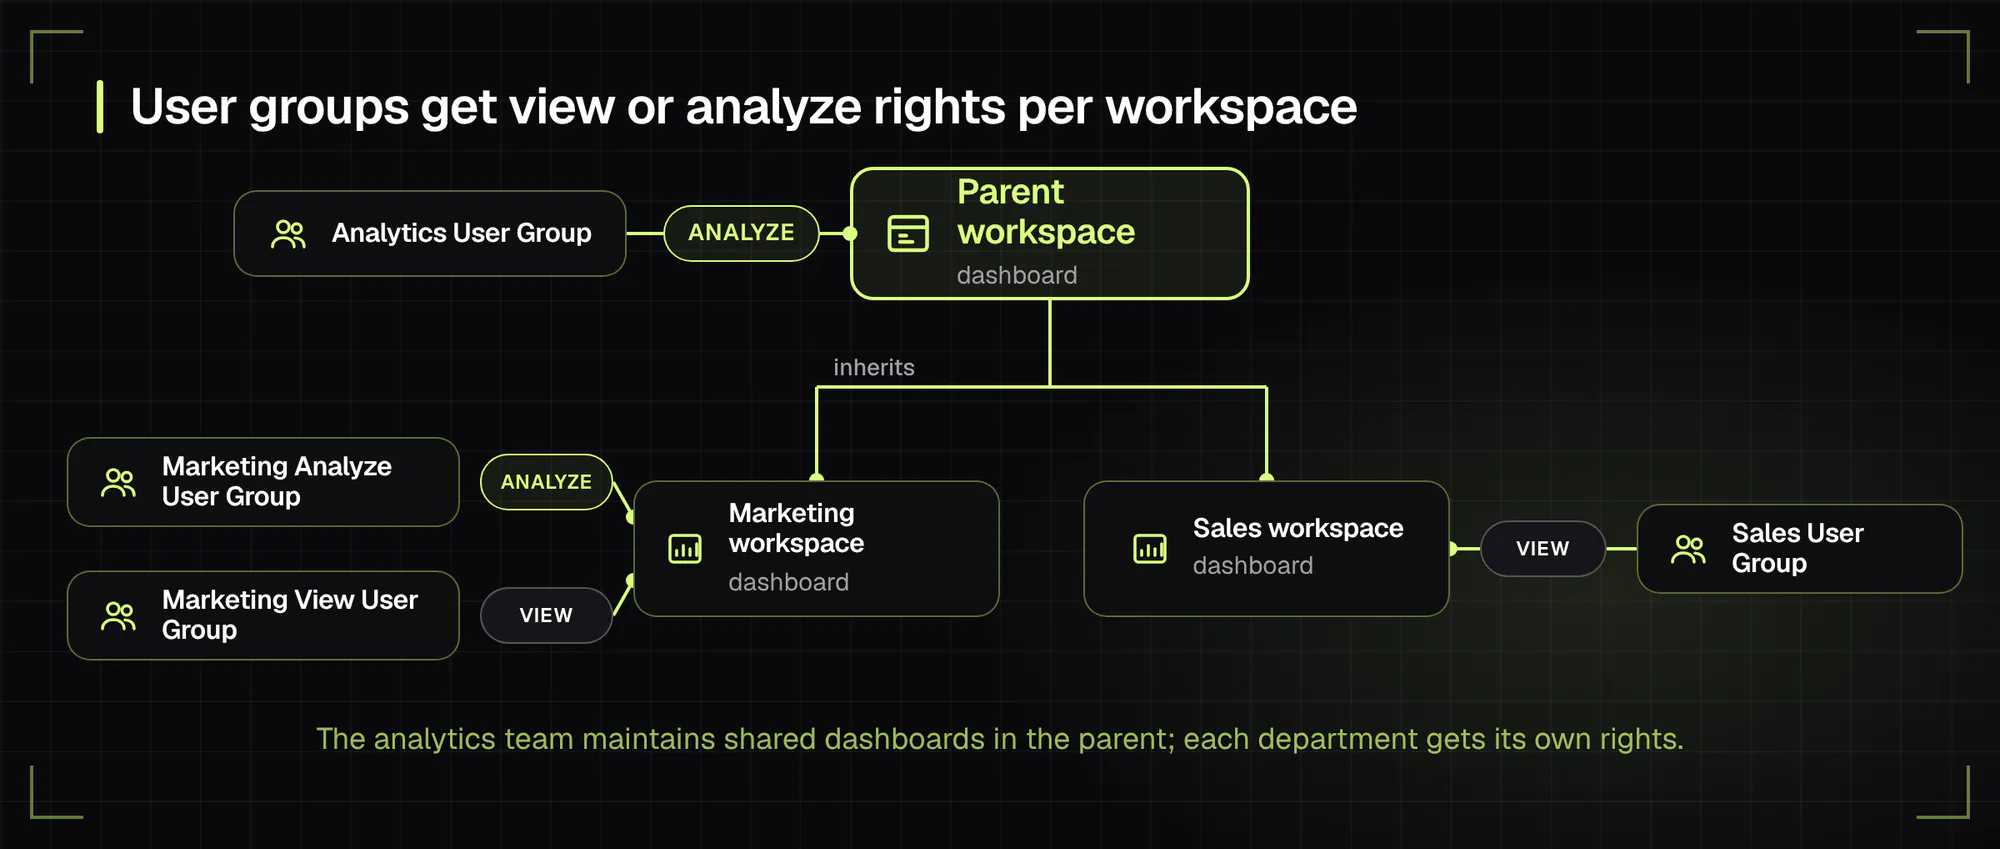
User groups and their permissions
GoodData.AI applies workspace, object-level (including column-level), and row-level permissions to every request, from people and from agents. For certifications, encryption, and deployment options, see GoodData.AI security and compliance.
Multi-Tenant Analytics for AI Agents
In multi-tenant analytics, an AI assistant or agent must stay inside the same tenant boundary as the user it answers. Embedded assistants and outside agents now query tenant data through natural-language questions and APIs, often in bursts, and they need the same isolation as a dashboard.
The risky shortcut is a shared service account: one technical identity with access to every tenant, plus an instruction in the prompt to answer only about the current customer. The tenant boundary then depends on whether the model follows instructions, and the audit log shows the service account instead of the person who asked.
GoodData.AI's position: an agent is one more consumer of the governed layer underneath BI, apps, agents, and MCP clients, so every agent request carries the end user's identity and tenant context, and the same workspace filters and permissions apply as on a dashboard. This differs from the common default of giving agents their own broad credentials and filtering in the prompt.
In GoodData.AI, that position translates into four mechanisms:
- MCP Server: the GoodData.AI MCP Server gives agents and AI tools such as Claude, Cursor, and ChatGPT the same governed metrics, with the user's own permissions and company SSO sign-in (in beta).
- A2A: through the Agent2Agent (A2A) protocol, your own agents can delegate analytics tasks to GoodData.AI agents with OAuth and end-user permissions.
- Per-tenant context: AI memory and AI knowledge ground the AI Assistant in each workspace's business terms, and knowledge added in a parent workspace can be inherited by its child workspaces.
- Per-tenant load: caching with validity periods keeps repeated agent questions off production warehouse compute, tenant data marts give each tenant its own fast in-memory mart, built on open formats such as Apache Iceberg, and per-user AI Assistant limits in each workspace keep one tenant's AI usage from crowding out the others.
For example, when a user at Customer A asks the embedded AI Assistant for last quarter's revenue by region, the answer is computed in Customer A's workspace, through the same certified metric as Customer A's dashboard, and limited by the same filters. Read more about governed analytics for AI agents and building an MCP server for AI-native analytics.
Common Mistakes in Multi-Tenant Analytics
Most multi-tenant analytics problems appear months after launch, when the tenant count grows and nobody remembers which customer got which copy. Four mistakes cause most of them:
- Copying dashboards per customer. Copies drift apart: a metric fix reaches only the copies someone remembers to update. Define metrics and dashboards once in a parent and let tenants inherit them.
- Assuming connected data is private by default. In GoodData.AI, data from a connected data source is available to every workspace that uses it until the hierarchy and data filters are set up. Set the filters before the first tenant signs in.
- Filtering in the front end only. A dashboard filter or client-side code hides data but doesn't isolate it. As the AWS SaaS Tenant Isolation Strategies whitepaper recommends, enforce isolation centrally instead of leaving it to each developer.
Giving AI agents a service account. It bypasses the tenant boundary described in the previous section; let agents query with the user's identity.
Multi-Tenant Analytics Solution Use Cases
Multi-tenant analytics fits any organization that delivers the same analytics to many separate groups. The most common use cases are:
- Customer-facing analytics in SaaS products: each customer is a tenant and sees dashboards inside the product. Atheer gives each of its customers a secure analytics workspace inside its frontline operations platform, with ready-made dashboards that customers can extend.
- Companies with many branches or franchise units: each location tracks its own performance with company-wide metrics, and headquarters sees the total.
- Partner and reseller networks: each partner sees its own sales or service data, without access to other partners' data.
- Data products: companies package their data as analytics that customers pay for, which turns a reporting cost into revenue.
Customers run this at scale. Shift Technology delivers its fraud-detection analytics to a wide range of insurance companies through more than 100 workspaces. LiveVox embedded contact-center performance analytics in its product, pushes updates to all customer workspaces, and lists growth to more than 70 customers over five years among its results.
Multi-tenant analytics works in any industry and is especially common in e-commerce, financial services, insurance, software companies, manufacturing, healthcare, and franchises.
The Pricing Model for a Multi-Tenant Solution
The cost of multi-tenant analytics grows with three things: the number of tenants, the number of users per tenant, and the query load they put on your data warehouse. Analytics vendors license these differently, so estimate how each will grow before you compare offers.
- Tenants: every tenant adds a workspace to create, filter, and maintain. Automating onboarding through APIs and analytics as code keeps that work flat as the count grows.
- Users: in B2B products, the number of users per customer is often unpredictable, which matters if a license counts users.
- Query load: every dashboard view and every agent question becomes warehouse compute, and agents add bursts. In GoodData.AI, caching with validity periods keeps repeated queries off production warehouse compute, and tenant data marts serve bursty tenants from their own mart.
For a comparison of licensing models in embedded analytics, see how to choose the right pricing model.
Ready To Get Started With Multi-tenant Analytics?
GoodData.AI puts analytics, AI, and agents on one Agentic Serving Plane: one trusted definition behind every number, running where your data has to stay. For multi-tenant analytics, that means one workspace hierarchy for all your customers, data filters and permissions on every query, and the same rules when AI agents ask the questions.
Serve every customer from one analytics setup. See how workspaces, data filters, and permissions work in the multitenancy product tour, or request a demo to walk through your own tenant model with our team.
Experience GoodData in Action
Fully managed, multi-tenant analytics platform. Get instant access — no installation or credit card required.
Explore product toursFrequently Asked Questions
Embedded analytics places dashboards and reports inside another application, while multi-tenant analytics serves many tenants from one setup with each tenant's data kept separate. The two usually go together: a SaaS company embeds analytics in its product and runs it multi-tenant so every customer sees only its own data. Read more about embedded analytics.
A multi-tenant dashboard is one dashboard definition that many tenants open, each seeing it filled with its own data. The dashboard is built once, usually in a parent workspace, and every change to it reaches all tenants at the same time.
Implement row-level security in two steps: first, scope each tenant's workspace with a tenant filter, such as a customer ID column; then, add user-level filters for people who should see only part of their tenant's data. Enforce both on the server for every query, not in the dashboard, and test them by trying to read across tenants.
Onboard a new tenant by creating a child workspace under the right parent, assigning its data filter value, and adding its users or connecting its identity provider. With the workspace layout API, the same step runs for one tenant or hundreds, so onboarding becomes part of your product's provisioning flow.
Roll out a change by making it once in the parent workspace, which passes it to every child workspace. With analytics as code, semantic models, metrics, and dashboards are version-controlled YAML, so the change is reviewed and tested like any other release before it reaches tenants.
AI agents can query multi-tenant analytics safely when they use the identity of the user they act for, so the same tenant filters and permissions apply as on a dashboard. An agent with a shared service account and broad access bypasses the tenant boundary and makes audits unreliable.